Costco 2004 Annual Report Download - page 3
Download and view the complete annual report
Please find page 3 of the 2004 Costco annual report below. You can navigate through the pages in the report by either clicking on the pages listed below, or by using the keyword search tool below to find specific information within the annual report.-
 1
1 -
 2
2 -
 3
3 -
 4
4 -
 5
5 -
 6
6 -
 7
7 -
 8
8 -
 9
9 -
 10
10 -
 11
11 -
 12
12 -
 13
13 -
 14
14 -
15
-
16
-
17
-
18
-
19
-
20
-
21
-
22
-
23
-
24
-
25
-
26
-
27
-
28
-
29
-
30
-
31
-
32
-
33
-
34
-
35
-
36
-
37
-
38
-
39
-
40
-
41
-
42
-
43
-
44
-
45
-
46
-
47
-
48
-
49
-
50
-
51
-
52
-
53
-
54
-
55
-
56
 |
 |
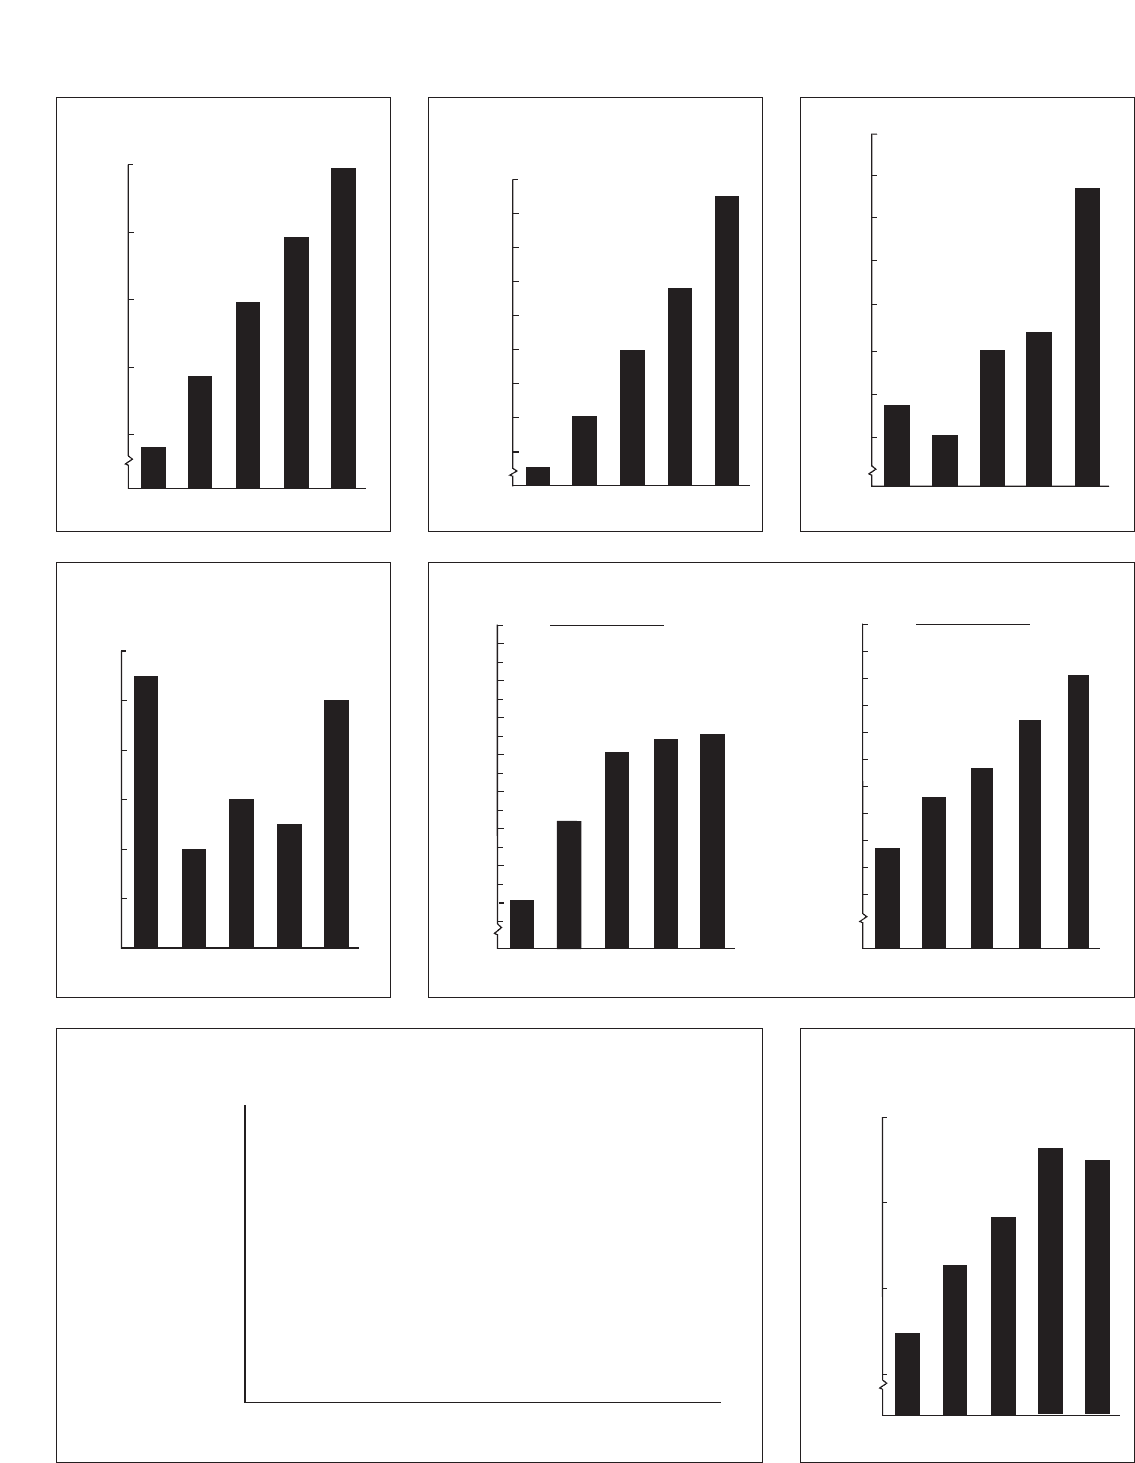
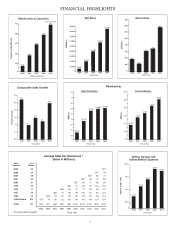
Warehouses in Operation
At Fiscal Year End
Number of Warehouses
425
400
2000 2001 2003
375
350
313
345
397
(424 at 12/31/04)
325
0
2004
417
2002
374
Net Sales
Fiscal Year
$ Millions
44,000
46,000
48,000
42,000
40,000
38,000
36,000
34,000
2000 2001 2003 2004
34,137
37,993
31,621
2002
41,693
47,146
32,000
0
Net Income
Fiscal Year
$ Millions
2000 2001 2003
850
900
950
0
700
750
800
600
650
602
631
721
2004
882
2002
700
Comparable Sales Growth
Fiscal Year
Percent Increase
2000 2001 2003 2004
10%
0%
2%
4%
6%
8%
10%
12%
2002
5%
6%
11%
4%
A
ve
r
a
g
e
S
a
l
e
s
P
e
r
W
a
r
e
hou
s
e
*
(
S
a
l
e
s
I
n
M
illion
s
)
Fiscal Year
*First year sales annualized.
2001
114
83
106
86
77
65
$57
$101
2000
110
80
99
77
72
$57
$101
1999
100
68
85
$65
58
$94
1998
92
61
70
$50
$87
1997
86
53
$56
$83
1996
79
$46
$77
1995
$75
$75
417
T
ot
a
l
s
2311995
&
B
e
fo
r
e
181996
101997
171998
151999
212000
322001
292002
242003
202004
W
h
s
e
s
*O
p
e
n
e
d
#
of
Y
ea
r
2002
119
87
113
97
82
77
63
$58
$103
2003
124
94
115
105
86
85
72
62
$105
$67
2004
134
104
124
120
91
98
84
77
$115
79
$72
Selling, General and
Administrative Expenses
Fiscal Year
Percent of Net Sales
2000 2001 2002
0
10.0%
9.5%
9.0%
9.41%
8.71%
9.17%
2003
9.83%
2004
9.75%
8.5%
Fiscal Year
2000 2001 2003
4.170
4.636
4.358
4.0
4.2
4.4
4.6
4.8
5.0
0
2004
4.810
2002
4.476
Business Members
Fiscal Year
Millions
Millions
2000 2001 2003
10.521
12.737
14.984
0
12
14
18
17
11
13
16
15
2004
15.018
2002
14.597
Gold Star Members
Membership
10
FINANCIAL HIGHLIGHTS
1