CVS 1998 Annual Report Download - page 40
Download and view the complete annual report
Please find page 40 of the 1998 CVS annual report below. You can navigate through the pages in the report by either clicking on the pages listed below, or by using the keyword search tool below to find specific information within the annual report.-
 1
1 -
2
-
3
-
4
-
5
-
6
-
7
-
8
-
9
-
10
-
11
-
12
-
13
-
14
-
15
-
16
-
17
-
18
-
19
-
20
-
21
-
22
-
23
-
24
-
25
-
26
-
27
-
28
-
29
-
 30
30 -
 31
31 -
 32
32 -
 33
33 -
 34
34 -
 35
35 -
 36
36 -
 37
37 -
 38
38 -
 39
39 -
 40
40 -
 41
41 -
 42
42 -
 43
43 -
 44
44
 |
 |

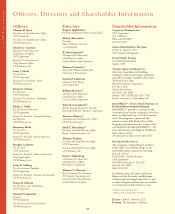
CVS Corporation
fifteen
38
fourteen
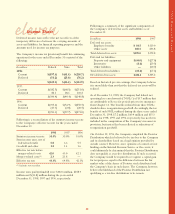
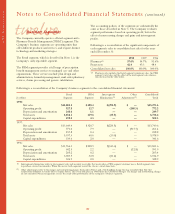
Commitments & Contingencies
In connection with certain business dispositions completed
between 1991 and 1997, the Company continues to
guarantee lease obligations for approximately 1,600 former
stores. The Company is indemnified for these obligations by
the respective purchasers. Assuming that each respective
purchaser became insolvent, an event which the Company
believes to be highly unlikely, management estimates that it
could settle these obligations for approximately $1.1 billion
as of December 31, 1998.
Notes to Consolidated Financial Statements (continued)
In the opinion of management, the ultimate disposition of
these guarantees will not have a material adverse effect on
the Company’s consolidated financial condition, results of
operations or future cash flows.
The Company is also a defendant in various lawsuits arising
in the ordinary course of business. In the opinion of
management and the Company’s outside counsel, the
ultimate disposition of these lawsuits, exclusive of potential
insurance recoveries, will not have a material adverse effect
on the Company’s consolidated financial condition, results
of operations or future cash flows.
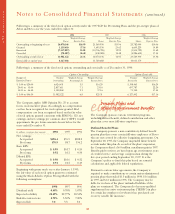
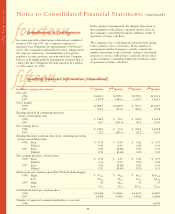
Quarterly Financial Information (Unaudited)
In millions, except per share amounts 1st Quarter 2nd Quarter 3rd Quarter 4th Quarter
Net sales:
1998 $3,601.5 $3,755.9 $3,725.1 $4,191.1
1997 3,397.8 3,406.8 3,328.7 3,616.3
Gross margin:
1998 $1,006.9 $1,020.5 $ 995.3 $1,106.5
1997 967.9 873.0 905.6 971.8
Earnings (loss) from continuing operations
before extraordinary item:
1998 $ 132.0 $ 16.2 $ 102.4 $ 145.8
1997 92.1 (221.4) 82.2 123.6
Net earnings (loss):
1998 $ 132.0 $ 16.2 $ 102.4 $ 145.8
1997 92.2 (221.1) 82.2 123.6
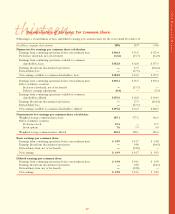
Earnings (loss) per common share from continuing operations
before extraordinary item:
1998: Basic $ 0.34 $ 0.03 $ 0.25 $ 0.37
Diluted 0.33 0.03 0.25 0.36
1997: Basic 0.24 (0.60) 0.21 0.31
Diluted 0.23 (0.60) 0.20 0.31
Net earnings (loss) per common share:
1998: Basic $ 0.34 $ 0.03 $ 0.25 $ 0.37
Diluted 0.33 0.03 0.25 0.36
1997: Basic 0.24 (0.60) 0.21 0.31
Diluted 0.23 (0.60) 0.20 0.31
Market price per common share (New York Stock Exchange):
1998: High $ 377/16 $39
5/8 $46
1/2 $5511/16
Low 311/16 333/8 363/8 421/16
1997: High 24 267/8 30 35
Low 191/2 221/8 257/16 275/16
Dividends declared per common share:
1998 $ 0.0550 $ 0.0550 $ 0.0575 $0.0575
1997 0.0550 0.0550 0.0550 0.0550
Number of registered common shareholders at year-end:
1998 10,500