CVS 1998 Annual Report Download - page 35
Download and view the complete annual report
Please find page 35 of the 1998 CVS annual report below. You can navigate through the pages in the report by either clicking on the pages listed below, or by using the keyword search tool below to find specific information within the annual report.-
 1
1 -
2
-
3
-
4
-
5
-
6
-
7
-
8
-
9
-
10
-
11
-
12
-
13
-
14
-
15
-
16
-
17
-
18
-
19
-
20
-
21
-
22
-
23
-
24
-
 25
25 -
 26
26 -
 27
27 -
 28
28 -
 29
29 -
 30
30 -
 31
31 -
 32
32 -
 33
33 -
 34
34 -
 35
35 -
 36
36 -
 37
37 -
 38
38 -
 39
39 -
 40
40 -
 41
41 -
 42
42 -
 43
43 -
 44
44
 |
 |

33
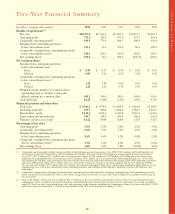
1998 Financial Report
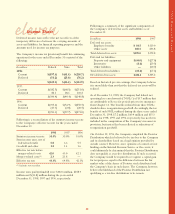
The Company also sponsors an Employee Stock Ownership
Plan. See Note 9 for further information about this plan.
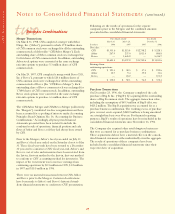
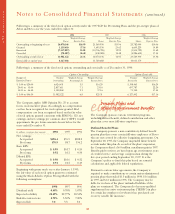
Other Postretirement Benefits
The Company provides postretirement healthcare and life
insurance benefits to retirees who meet eligibility
requirements. The Company’s funding policy is generally
to pay covered expenses as they are incurred.
Defined Contribution Plans
The Company sponsors a Profit Sharing Plan and a 401(k)
Savings Plan that cover substantially all employees who meet
plan eligibility requirements. The Company also maintains a
non-qualified, unfunded Deferred Compensation Plan for
certain key employees. The Company’s contributions under
the above defined contribution plans totaled $26.4 million in
1998, $24.1 million in 1997 and $19.5 million in 1996.
Defined Benefit Plans Other Postretirement Benefits
In millions 1998 1997 1998 1997
Change in benefit obligation:
Benefit obligation at beginning of year $253.3 $255.1 $ 14.4 $ 15.5
Service cost 0.5 7.6 ——
Interest cost 19.5 19.2 1.0 1.0
Actuarial loss (gain) 49.3 (10.4) 0.5 (0.7)
Benefits paid (25.0) (18.2) (1.9) (1.4)
Benefit obligation at end of year $297.6 $253.3 $ 14.0 $ 14.4
Change in plan assets:
Fair value at beginning of year $201.5 $172.8 $— $—
Actual return on plan assets 28.4 20.0 ——
Company contributions 18.2 26.9 1.9 1.4
Benefits paid (25.0) (18.2) (1.9) (1.4)
Fair value at end of year(1) $223.1 $201.5 $— $—
Funded status:
Funded status $(74.5) $(51.8) $(14.0) $(14.5)
Unrecognized prior service cost 1.3 1.6 (1.0) (1.1)
Unrecognized net loss (gain) 1.6 (8.4) (0.3) (1.0)
Accrued pension costs $(71.6) $(58.6) $(15.3) $(16.6)
Weighted average assumptions:
Discount rate 6.75% 7.25% 6.75% 7.25%
Expected return on plan assets 9.00% 9.00% ——
Rate of compensation increase 4.50% 4.50% ——
(1) Plan assets consist primarily of mutual funds, common stock and insurance contracts.
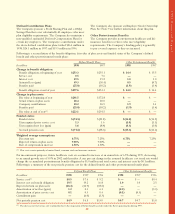
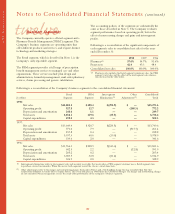
For measurement purposes, future healthcare costs are assumed to increase at an annual rate of 6.5% during 1999, decreasing
to an annual growth rate of 5.0% in 2002 and thereafter. A one percent change in the assumed healthcare cost trend rate would
change the accumulated postretirement benefit obligation by $1.0 million and total service and interest costs by $0.1 million.
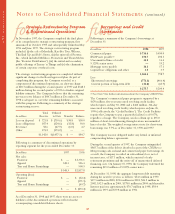
Following is a summary of the net periodic pension cost for the defined benefit and other postretirement benefit plans:
Defined Benefit Plans Other Postretirement Benefits
In millions 1998 1997 1996 1998 1997 1996
Service cost(1) $0.5 $ 7.6 $ 9.2 $— $ — $0.4
Interest cost on benefit obligation 19.5 19.2 16.8 1.0 1.0 2.5
Expected return on plan assets (16.4) (14.9) (18.2) ———
Amortization of net loss (gain) 1.2 0.3 6.1 (0.2) — (1.1)
Amortization of prior service cost 0.1 0.3 0.4 (0.1) (0.3) —
Curtailment gain —(6.0) (1.3) ———
Net periodic pension cost $4.9 $ 6.5 $13.0 $0.7 $0.7 $1.8
(1) The decrease in total service cost is primarily due to the suspension of future benefit accruals under the Revco pension plan during 1997.
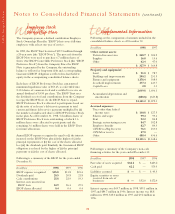
Following is a reconciliation of the benefit obligation, fair value of plan assets and funded status of the Company’s defined
benefit and other postretirement benefit plans: