CVS 1998 Annual Report Download - page 37
Download and view the complete annual report
Please find page 37 of the 1998 CVS annual report below. You can navigate through the pages in the report by either clicking on the pages listed below, or by using the keyword search tool below to find specific information within the annual report.-
 1
1 -
2
-
3
-
4
-
5
-
6
-
7
-
8
-
9
-
10
-
11
-
12
-
13
-
14
-
15
-
16
-
17
-
18
-
19
-
20
-
21
-
22
-
23
-
24
-
25
-
26
-
 27
27 -
 28
28 -
 29
29 -
 30
30 -
 31
31 -
 32
32 -
 33
33 -
 34
34 -
 35
35 -
 36
36 -
 37
37 -
 38
38 -
 39
39 -
 40
40 -
 41
41 -
 42
42 -
 43
43 -
 44
44
 |
 |

35
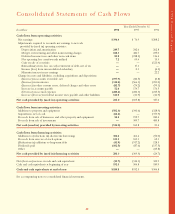
1998 Financial Report
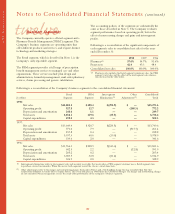
Following is a summary of the significant components of
the Company’s deferred tax assets and liabilities as of
December 31:
In millions 1998 1997
Deferred tax assets:
Employee benefits $ 84.5 $119.0
Other assets 185.5 253.8
Total deferred tax assets $270.0 $372.8
Deferred tax liabilities:
Property and equipment $(44.0) $(27.0)
Inventories (1.6) (29.9)
Other liabilities —(10.7)
Total deferred tax liabilites (45.6) (67.6)
Net deferred tax assets $224.4 $305.2
Based on historical pre-tax earnings, the Company believes
it is more likely than not that the deferred tax assets will be
realized.
As of December 31, 1998, the Company had federal net
operating loss carryforwards (“NOLs”) of $3.7 million that
are attributable to Revco for periods prior to its emergence
from Chapter 11. The benefits realized from these NOLs
should reduce reorganization goodwill. Accordingly, the tax
benefit of such NOLs utilized during the three years ended
December 31, 1998, $7.2 million, $69.4 million and $15.3
million for 1998, 1997 and 1996, respectively, has not been
included in the computation of the Company’s income tax
provision, but instead has been reflected as reductions of
reorganization goodwill.
On October 12, 1996, the Company completed the Footstar
Distribution which is believed to be tax-free to the Co
mpany
and its shareholders based on a legal opinion provided by
outside counsel. However, since opinions of counsel are not
binding on the Internal Revenue Service or the courts, it
could ultimately be determined that the Footstar Distribution
does not qualify as a tax-free distribution. If such occurred,
the Company would be required to recognize a capital gain
for tax purposes equal to the difference between the fair
market value of the shares of Footstar stock distributed and
the Company’s basis in such shares. The Company, however,
believes the likelihood of the Footstar Distribution not
qualifying as a tax-free distribution to be remote.
eleven
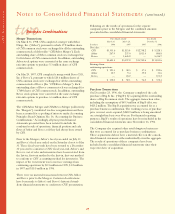
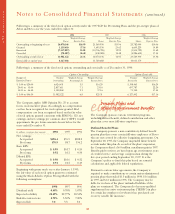
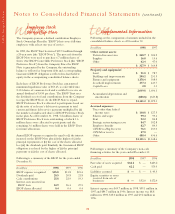
Income Taxes
Deferred income taxes reflect the net tax effects of the
temporary differences between the carrying amounts of
assets and liabilities for financial reporting purposes and the
amounts used for income tax purposes.
The Company’s income tax (provision) benefit for continuing
operations for the years ended December 31 consisted of the
following:
In millions Federal State Total
1998:
Current $(197.3) $(41.4) $(238.7)
Deferred (51.2) (25.0) (76.2)
$(248.5) $(66.4) $(314.9)
1997:
Current $(182.5) $(68.5) $(251.0)
Deferred 82.1 28.1 110.2
$(100.4) $(40.4) $(140.8)
1996:
Current $(195.6) $(54.9) $(250.5)
Deferred (17.7) (2.8) (20.5)
$(213.3) $(57.7) $(271.0)
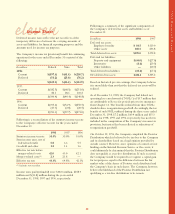
Following is a reconciliation of the statutory income tax rate
to the Company’s effective tax rate for the years ended
December 31:
1998 1997 1996
Statutory income tax rate 35.0% 35.0% 35.0%
State income taxes, net of
federal tax benefit 5.8 6.6 5.5
Goodwill and other 1.2 1.4 1.6
Effective tax rate before
merger-related costs 42.0 43.0 42.1
Merger-related costs(1) 2.3 21.8 —
Effective tax rate 44.3% 64.8% 42.1%
(1) Includes state tax effect.
Income taxes paid (refunded) were $102.6 million, $258.9
million and $(33.8) million during the years ended
December 31, 1998, 1997 and 1996, respectively.