CVS 1998 Annual Report Download - page 36
Download and view the complete annual report
Please find page 36 of the 1998 CVS annual report below. You can navigate through the pages in the report by either clicking on the pages listed below, or by using the keyword search tool below to find specific information within the annual report.-
 1
1 -
2
-
3
-
4
-
5
-
6
-
7
-
8
-
9
-
10
-
11
-
12
-
13
-
14
-
15
-
16
-
17
-
18
-
19
-
20
-
21
-
22
-
23
-
24
-
25
-
 26
26 -
 27
27 -
 28
28 -
 29
29 -
 30
30 -
 31
31 -
 32
32 -
 33
33 -
 34
34 -
 35
35 -
 36
36 -
 37
37 -
 38
38 -
 39
39 -
 40
40 -
 41
41 -
 42
42 -
 43
43 -
 44
44
 |
 |

34
CVS Corporation
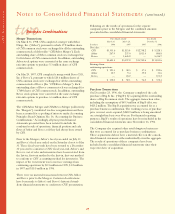
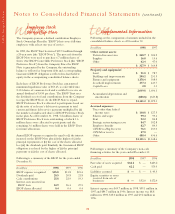
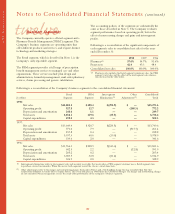
tennine Supplemental Information
Following are the components of amounts included in the
consolidated balance sheets as of December 31:
In millions 1998 1997
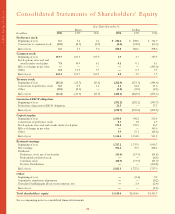
Other current assets:
Deferred income taxes $ 248.7 $ 304.2
Supplies 16.8 13.6
Other 62.4 47.0
$ 327.9 $ 364.8
Property and equipment:
Land $ 91.0 $ 78.7
Buildings and improvements 290.2 231.5
Fixtures and equipment 1,178.4 938.9
Leasehold improvements 477.4 443.7
Capital leases 2.8 3.3
2,039.8 1,696.1
Accumulated depreciation and
amortization (688.6) (623.8)
$1,351.2 $1,072.3
Accrued expenses:
Taxes other than federal
income taxes $ 130.8 $ 127.5
Salaries and wages 99.4 99.6
Rent 92.2 84.8
Strategic restructuring reserve 84.7 102.8
Employee benefits 82.7 84.3
CVS/Revco/Big B reserve 76.1 233.0
CVS/Arbor reserve 57.0 —
Other 488.4 436.6
$1,111.3 $1,168.6
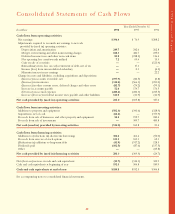
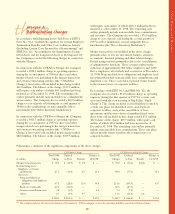
Following is a summary of the Company’s non-cash
financing activities for the years ended December 31:
In millions 1998 1997 1996
Fair value of assets acquired $ 62.2 $ — $423.2
Cash paid 62.2 — 373.9
Liabilities assumed $— $ — $ 49.3
Equity securities or notes
received from sale of
businesses $— $52.0 $172.4
Interest expense was $69.7 million in 1998, $59.1 million in
1997 and $84.7 million in 1996. Interest income was $8.8
million in 1998, $15.0 million in 1997 and $9.2 million in
1996.
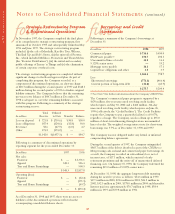
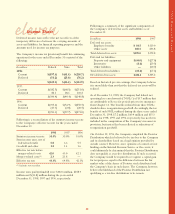
Employee Stock
Ownership Plan
The Company sponsors a defined contribution Employee
Stock Ownership Plan (the “ESOP”) that covers full-time
employees with at least one year of service.
In 1989, the ESOP Trust borrowed $357.5 million through
a 20-year note (the “ESOP Note”). The proceeds from the
ESOP Note were used to purchase 6.7 million shares of
Series One ESOP Convertible Preference Stock (the “ESOP
Preference Stock”) from the Company. Since the ESOP
Note is guaranteed by the Company, the outstanding
balance is reflected as long-term debt and a corresponding
Guaranteed ESOP obligation is reflected in shareholders’
equity in the accompanying consolidated balance sheets.
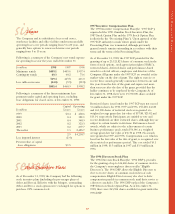
Each share of ESOP Preference Stock has a guaranteed
minimum liquidation value of $53.45, is convertible into
2.314 shares of common stock and is entitled to receive an
annual dividend of $3.90 per share. The ESOP Trust uses
the dividends received and contributions from the Company
to repay the ESOP Note. As the ESOP Note is repaid,
ESOP Preference Stock is allocated to participants based on:
(i) the ratio of each year’s debt service payment to total
current and future debt service payments multiplied by (ii)
the number of unallocated shares of ESOP Preference Stock
in the plan. As of December 31, 1998, 5.2 million shares of
ESOP Preference Stock were outstanding, of which 1.6
million shares were allocated to participants and the
remaining 3.6 million shares were held in the ESOP Trust
for future allocations.
Annual ESOP expense recognized is equal to (i) the interest
incurred on the ESOP Note plus (ii) the higher of (a) the
principal repayments or (b) the cost of the shares allocated,
less (iii) the dividends paid. Similarly, the Guaranteed ESOP
obligation is reduced by the higher of (i) the principal
payments or (ii) the cost of shares allocated.
Following is a summary of the ESOP for the years ended
December 31:
In millions 1998 1997 1996
ESOP expense recognized $25.8 $13.8 $15.4
Dividends paid 20.5 20.8 21.8
Cash contributions 25.8 22.9 19.3
Interest costs incurred on
ESOP loan 24.9 26.4 27.5
ESOP shares allocated 0.4 0.4 0.4
Notes to Consolidated Financial Statements (continued)