CVS 1998 Annual Report Download - page 26
Download and view the complete annual report
Please find page 26 of the 1998 CVS annual report below. You can navigate through the pages in the report by either clicking on the pages listed below, or by using the keyword search tool below to find specific information within the annual report.-
 1
1 -
2
-
3
-
4
-
5
-
6
-
7
-
8
-
9
-
10
-
11
-
12
-
13
-
14
-
15
-
 16
16 -
 17
17 -
 18
18 -
 19
19 -
 20
20 -
 21
21 -
 22
22 -
 23
23 -
 24
24 -
 25
25 -
 26
26 -
 27
27 -
 28
28 -
 29
29 -
 30
30 -
 31
31 -
 32
32 -
 33
33 -
 34
34 -
 35
35 -
 36
36 -
37
-
38
-
39
-
40
-
41
-
42
-
43
-
44
 |
 |

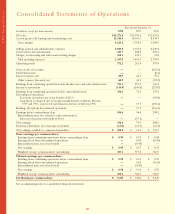
24
CVS Corporation
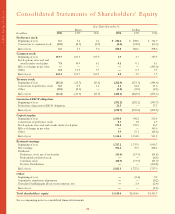
Years Ended December 31,
Shares Dollars
In millions 1998 1997 1996 1998 1997 1996
Preference stock:
Beginning of year 5.3 5.6 6.3 $ 284.6 $ 298.6 $ 334.9
Conversion to common stock (0.1) (0.3) (0.7) (4.6) (14.0) (36.3)
End of year 5.2 5.3 5.6 280.0 284.6 298.6
Common stock:
Beginning of year 393.7 369.3 357.5 3.9 3.7 357.5
Stock options exercised and
awards under stock plans 7.5 10.9 4.1 0.1 0.1 4.1
Effect of change in par value ——— —— (365.6)
Other 0.2 13.5 7.7 —0.1 7.7
End of year 401.4 393.7 369.3 4.0 3.9 3.7
Treasury stock:
Beginning of year (11.3) (11.7) (13.1) (262.9) (273.1) (304.6)
Conversion of preference stock 0.2 0.5 1.4 4.2 12.2 31.6
Other (0.1) (0.1) — (1.5) (2.0) (0.1)
End of year (11.2) (11.3) (11.7) (260.2) (262.9) (273.1)
Guaranteed ESOP obligation:
Beginning of year (292.2) (292.2) (309.7)
Reduction of guaranteed ESOP obligation 21.5 — 17.5
End of year (270.7) (292.2) (292.2)
Capital surplus:
Beginning of year 1,154.0 941.2 532.4
Conversion of preference stock 0.3 1.8 4.7
Stock options exercised and awards under stock plans 176.2 195.9 56.7
Effect of change in par value —— 365.6
Other 5.9 15.1 (18.2)
End of year 1,336.4 1,154.0 941.2
Retained earnings:
Beginning of year 1,727.2 1,737.9 1,956.7
Net earnings 396.4 76.9 208.2
Dividends:
Preference stock, net of tax benefit (13.6) (13.7) (14.4)
Redeemable preferred stock —— (0.1)
Common stock (88.9) (73.9) (51.7)
Footstar Distribution —— (360.8)
End of year 2,021.1 1,727.2 1,737.9
Other:
Beginning of year —(2.4) 0.2
Cumulative translation adjustment —— (0.2)
Unrealized holding gain (loss) on investments, net —2.4 (2.4)
End of year —— (2.4)
Total shareholders’ equity $3,110.6 $2,614.6 $2,413.7
See accompanying notes to consolidated financial statements.
Consolidated Statements of Shareholders’ Equity