CVS 1998 Annual Report Download - page 34
Download and view the complete annual report
Please find page 34 of the 1998 CVS annual report below. You can navigate through the pages in the report by either clicking on the pages listed below, or by using the keyword search tool below to find specific information within the annual report.-
 1
1 -
2
-
3
-
4
-
5
-
6
-
7
-
8
-
9
-
10
-
11
-
12
-
13
-
14
-
15
-
16
-
17
-
18
-
19
-
20
-
21
-
22
-
23
-
 24
24 -
 25
25 -
 26
26 -
 27
27 -
 28
28 -
 29
29 -
 30
30 -
 31
31 -
 32
32 -
 33
33 -
 34
34 -
 35
35 -
 36
36 -
 37
37 -
 38
38 -
 39
39 -
 40
40 -
 41
41 -
 42
42 -
 43
43 -
 44
44
 |
 |

CVS Corporation
eight
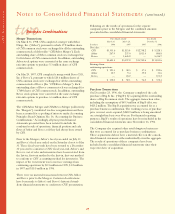
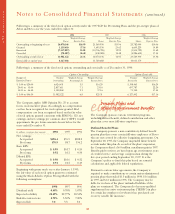
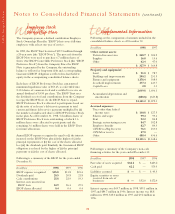
Pension Plans and
Other Postretirement Benefits
The Company sponsors various retirement programs,
including defined benefit, defined contribution and other
plans that cover most full-time employees.
Defined Benefit Plans
The Company sponsors a non-contributory defined benefit
pension plan that covers certain full-time employees of Revco
who are not covered by collective bargaining agreements. On
September 20, 1997, the Company suspended future benefit
accruals under this plan. As a result of the plan’s suspension,
the Company realized a $6.0 million curtailment gain in 1997.
Benefits paid to retirees are based upon age at retirement, years
of credited service and average compensation during the
five-year period ending September 20, 1997. It is the
Company’s policy to fund this plan based on actuarial
calculations and applicable federal regulations.
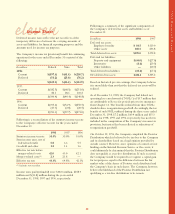
Pursuant to various labor agreements, the Company is
required to make contributions to certain union-administered
pension plans that totaled $1.5 million in 1998, $1.6 million
in 1997 and $1.2 million in 1996. The Company may be
liable for its share of the plans’ unfunded liabilities if the
plans are terminated. The Company also has non-qualified
supplemental executive retirement plans (“SERPs”) in place
for certain key employees for whom it has purchased cost
recovery variable life insurance.
32
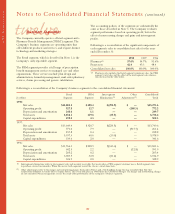
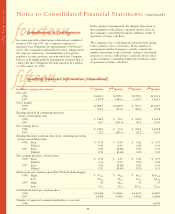
The Company applies APB Opinion No. 25 to account
for its stock incentive plans. Accordingly, no compensation
cost has been recognized for stock options granted. Had
compensation cost been recognized based on the fair value
of stock options granted consistent with SFAS No. 123, net
earnings and net earnings per common share (“EPS”) would
approximate the pro forma amounts shown below for the
years ended December 31.
In millions, except per share amounts 1998 1997 1996
Net earnings:
As reported $396.4 $76.9 $208.2
Pro forma 370.9 58.7 196.2
Basic EPS:
As reported $ 0.99 $0.17 $ 0.53
Pro forma 0.92 0.12 0.50
Diluted EPS:
As reported $ 0.98 $0.16 $ 0.52
Pro forma 0.91 0.12 0.49
Beginning with grants made on or after January 1, 1995,
the fair value of each stock option grant was estimated
using the Black-Scholes Option Pricing Model with the
following assumptions:
1998 1997 1996
Dividend yield 0.40% 0.70% 1.07%
Expected volatility 22.49% 22.77% 20.51%
Risk-free interest rate 5.75% 5.50% 7.00%
Expected life 7.0 5.5 5.0
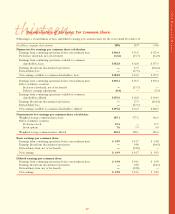
Following is a summary of the fixed stock option activity under the 1997 ICP, the Preexisting Plans and the pre-merger plans of
Arbor and Revco for the years ended December 31:
1998 1997 1996
Weighted Average Weighted Average Weighted Average
Shares Exercise Price Shares Exercise Price Shares Exercise Price
Outstanding at beginning of year 16,070,146 $16.95 23,569,930 $13.96 25,782,040 $14.06
Granted 3,119,410 37.16 3,695,530 23.62 6,609,229 14.80
Exercised (7,137,027) 15.01 (10,756,726) 12.99 (3,534,729) 11.62
Canceled (70,407) 26.48 (438,588) 14.48 (5,286,610) 17.35
Outstanding at end of year 11,982,122 23.31 16,070,146 16.95 23,569,930 13.96
Exercisable at end of year 6,127,402 11,729,688 10,011,179
Following is a summary of the fixed stock options outstanding and exercisable as of December 31, 1998:
Options Outstanding Options Exercisable
Range of Number Weighted Average Weighted Average Number Weighted Average
Exercise Prices Outstanding Remaining Life Exercise Price Exercisable Exercise Price
$ 5.00 to $20.00 6,024,451 5.5 $16.29 5,358,465 $16.24
20.01 to 35.00 2,857,611 7.1 23.10 697,787 22.20
35.01 to 46.50 3,100,060 9.1 37.16 71,150 37.45
$ 5.00 to $46.50 11,982,122 6.8 $23.31 6,127,402 $17.16
Notes to Consolidated Financial Statements (continued)