CVS 1998 Annual Report Download - page 3
Download and view the complete annual report
Please find page 3 of the 1998 CVS annual report below. You can navigate through the pages in the report by either clicking on the pages listed below, or by using the keyword search tool below to find specific information within the annual report.-
 1
1 -
 2
2 -
 3
3 -
 4
4 -
 5
5 -
 6
6 -
 7
7 -
 8
8 -
 9
9 -
 10
10 -
 11
11 -
 12
12 -
 13
13 -
 14
14 -
15
-
16
-
17
-
18
-
19
-
20
-
21
-
22
-
23
-
24
-
25
-
26
-
27
-
28
-
29
-
30
-
31
-
32
-
33
-
34
-
35
-
36
-
37
-
38
-
39
-
40
-
41
-
42
-
43
-
44
 |
 |
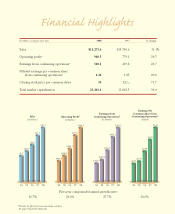
Financial Highlights
In millions, except per share data 1998 1997 % Change
Sales $15,273.6 $13,749.6 11.1%
Operating profit*940.5 779.1 20.7
Earnings from continuing operations*510.1 419.2 21.7
Diluted earnings per common share
from continuing operations*1.26 1.05 20.0
Closing stock price per common share 55 ½71.7
Total market capitalization 21,461.6 11,042.3 94.4
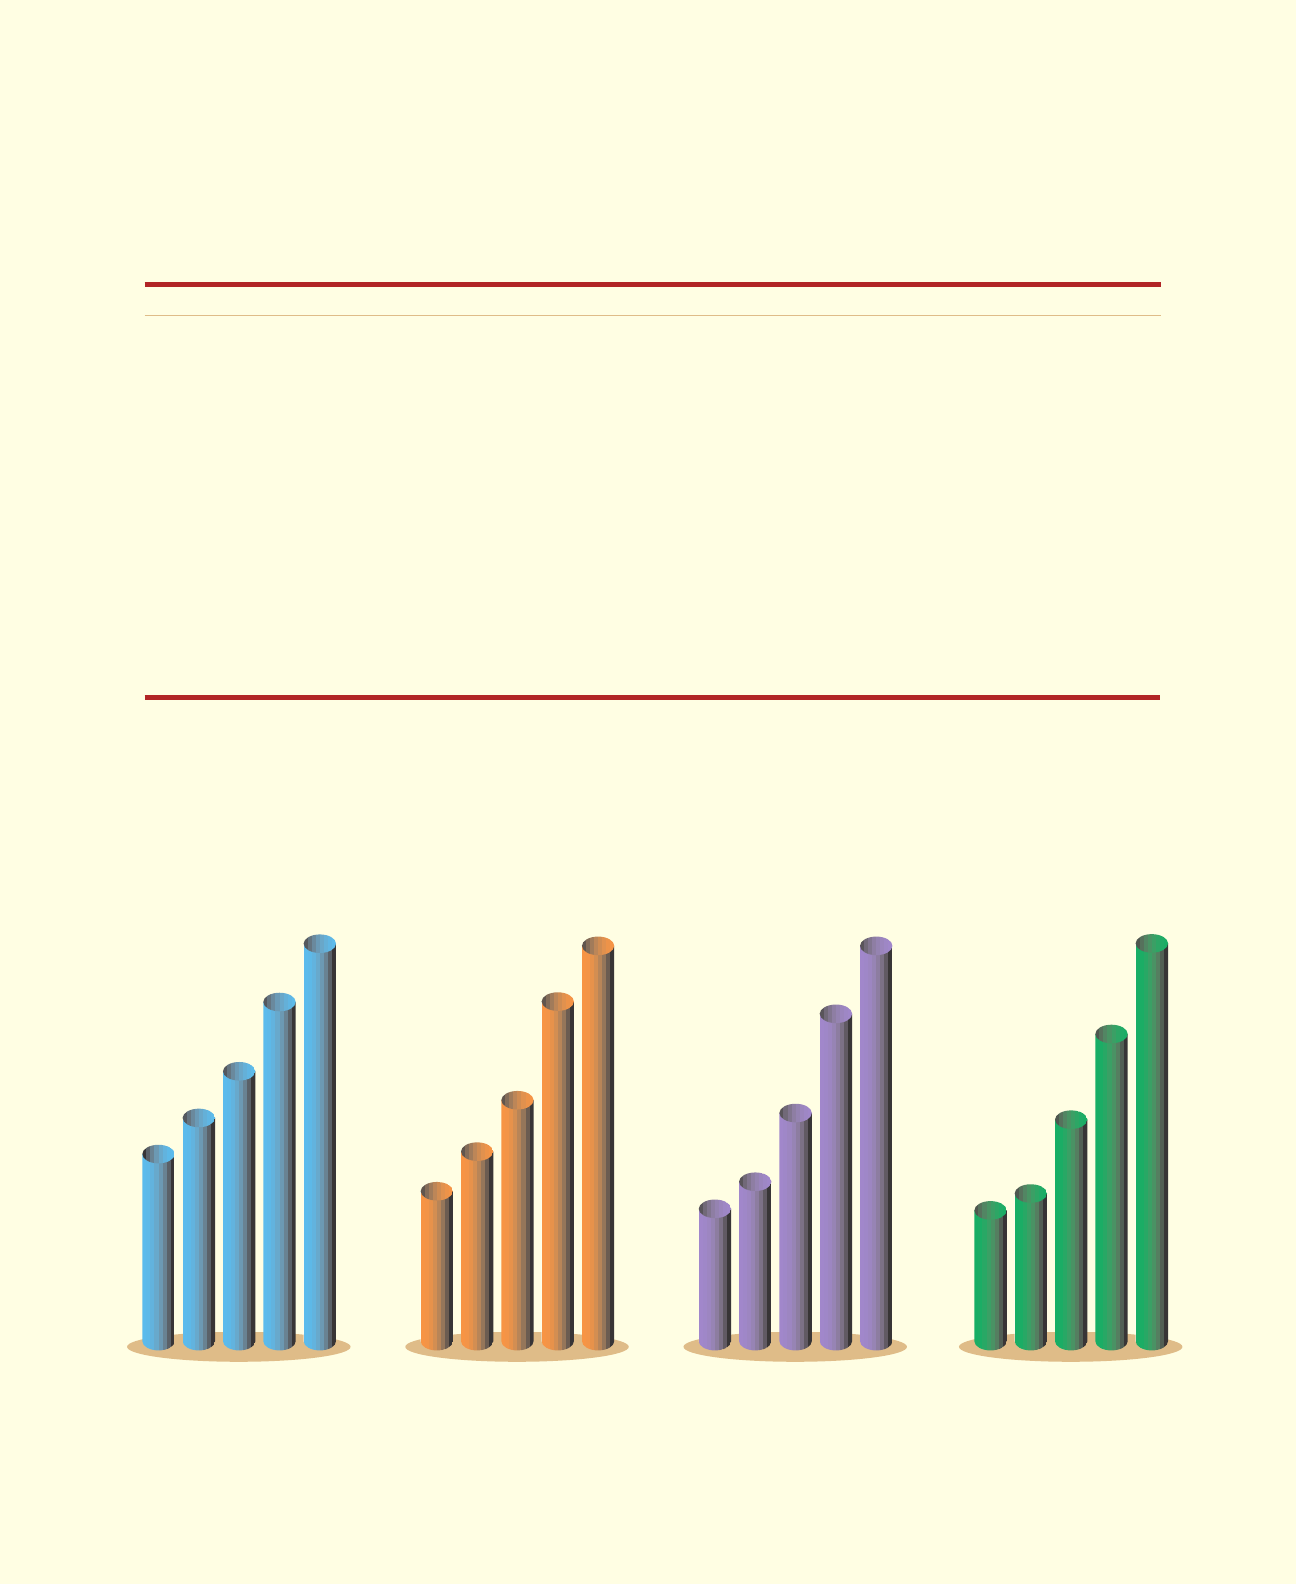
Sales
(In Billions)
Operating Profit*
(In Millions)
Earnings from
Continuing Operations*
(In Millions)
Earnings Per
Common Share from
Continuing Operations*
(Diluted)
Five-year compounded annual growth rates*
16.7% 24.6% 27.7% 24.6%
*Excludes the effect of non-recurring charges and gains.
See page 39 for further information.
$9.5
$10.5
$11.8
$13.7
$15.3
$416.8
$486.8
$604.7
$779.1
$940.5
$185.9
$210.2
$306.8
$419.2
$510.1
$0.47$0.53
$0.78
$1.05
$1.26
94 95 96 97 98 94 95 96 97 98 94 95 96 97 98 94 95 96 97 98
32½
32