Brother International 2012 Annual Report Download - page 9
Download and view the complete annual report
Please find page 9 of the 2012 Brother International annual report below. You can navigate through the pages in the report by either clicking on the pages listed below, or by using the keyword search tool below to find specific information within the annual report.-
 1
1 -
 2
2 -
 3
3 -
 4
4 -
 5
5 -
 6
6 -
 7
7 -
 8
8 -
 9
9 -
 10
10 -
 11
11 -
 12
12 -
 13
13 -
 14
14 -
 15
15 -
 16
16 -
 17
17 -
 18
18 -
 19
19 -
 20
20 -
21
-
22
-
23
-
24
-
25
-
26
-
27
-
28
-
29
-
30
-
31
-
32
-
33
-
34
-
35
-
36
-
37
-
38
-
39
-
40
-
41
-
42
-
43
-
44
-
45
-
46
-
47
-
48
-
49
-
50
-
51
-
52
-
53
-
54
-
55
-
56
-
57
-
58
-
59
-
60
-
61
 |
 |
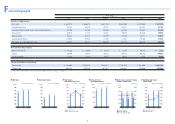
8
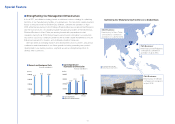
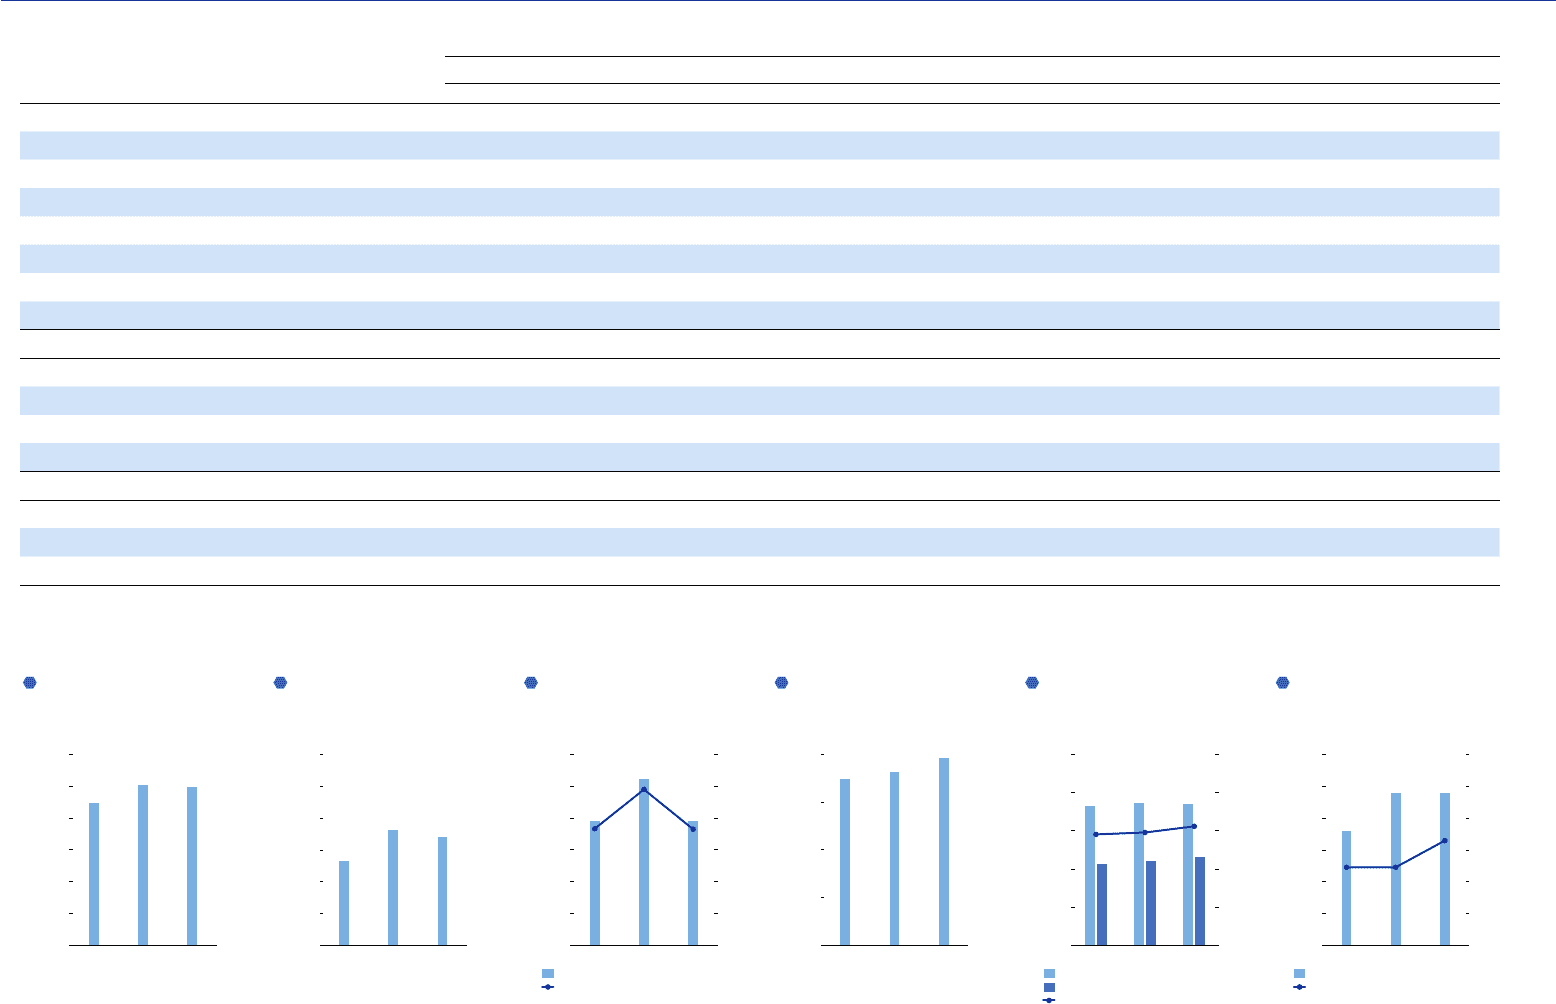
Millions of Yen
Fiscal years ended March 31
2007 2008 2009 2010 2011 2012
Results of Operations:
Net sales ¥ 562,273 ¥ 566,379 ¥ 482,205 ¥ 446,269 ¥ 502,830 ¥ 497,390
Operating income 51,255 53,503 19,901 26,637 36,092 34,183
Income before income taxes and minority interests 45,788 46,282 23,613 26,234 34,062 34,108
Net income 28,875 27,110 15,262 19,629 26,238 19,525
Depreciation 18,442 22,227 23,094 21,028 24,027 23,069
Capital expenditures 28,962 31,605 27,169 17,482 19,788 27,866
Research and development costs 28,454 34,117 36,859 34,779 36,253 39,232
Per Common Share (yen):
Basic net income ¥ 104.82 ¥ 98.46 ¥ 56.79 ¥ 73.34 ¥ 98.03 ¥ 72.95
Equity 763.94 785.13 735.26 792.95 822.43 863.01
Cash dividends 20.00 22.00 26.00*118.00 24.00 24.00
Financial Position at Year-End:
Total equit y ¥ 213,664 ¥ 219,223 ¥ 199,371 ¥ 213,532 ¥ 220,469 ¥ 231,425
Total assets 399,109 392,259 337,667 365,991 372,646 370,906
*1 Includes commemorative dividends of ¥2 per share to mark the 100th anniversary of the Company’s founding.
0
10
20
30
40
50
60
26.6
36.1 34.2
Operating Income
(¥ billion)
Fiscal years ended March 31
201220112010
0
201220112010
39.2
34.8 36.3
Fiscal years ended March 31
10
20
30
40
Research and
Development Costs
(¥ billion)
Net Sales
(¥ billion)
0
100
200
300
400
500
600
201220112010
497.4
446.3
502.8
Fiscal years ended March 31
Total assets (left)
Owners’ equity (left)
Total Assets & Owners’ Equity
Owners’ Equity Ratio
(¥ billion)
201220112010
(%)
0
100
200
300
400
500
0
20
40
60
80
100
366.0 372.6 370.9
212.5
58.1 59.1 62.3
220.5231.4
As of March 31
Owners’ equity ratio (right)
Net income (left)
Net Income
Net Income per Share
(¥ billion)
0
5
10
15
20
25
30
201220112010
20
40
60
80
100
120
0
(yen)
Net income per share (right)
19.6
73.3
98.0
73.0
26.2
19.5
Fiscal years ended March 31
Dividends per share (left)
Dividends per Share
Payout Ratio
(¥)
0
5
10
15
20
25
30
201220112010
0
Payout ratio (right)
10
20
30
40
50
60
18.0
32.9
24.524.5
24.0 24.0
(%)
Fiscal years ended March 31
Financial Highlights