Brother International 2012 Annual Report Download - page 15
Download and view the complete annual report
Please find page 15 of the 2012 Brother International annual report below. You can navigate through the pages in the report by either clicking on the pages listed below, or by using the keyword search tool below to find specific information within the annual report.-
 1
1 -
2
-
3
-
4
-
 5
5 -
 6
6 -
 7
7 -
 8
8 -
 9
9 -
 10
10 -
 11
11 -
 12
12 -
 13
13 -
 14
14 -
 15
15 -
 16
16 -
 17
17 -
 18
18 -
 19
19 -
 20
20 -
 21
21 -
 22
22 -
 23
23 -
 24
24 -
 25
25 -
26
-
27
-
28
-
29
-
30
-
31
-
32
-
33
-
34
-
35
-
36
-
37
-
38
-
39
-
40
-
41
-
42
-
43
-
44
-
45
-
46
-
47
-
48
-
49
-
50
-
51
-
52
-
53
-
54
-
55
-
56
-
57
-
58
-
59
-
60
-
61
 |
 |

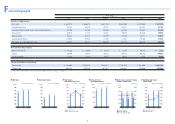
14
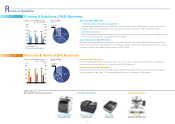
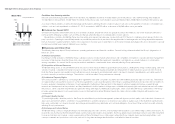
Review of Operations
Net sales: ¥70,423 million
Industrial sewing machines
Net sales dipped 9.8% year-on-year to ¥21,750 million, owing to weak demand in the second half for capital
investments in garment manufacturing industries mainly in China and other Asian countries.
Machine tools
Net sales rose 15.0% compared to the previous fiscal year to ¥48,672 million thanks to robust demand mainly
from China and other Asian countries.
Operating income: ¥8,345 million
An increase in sales of machine tools helped boost operating income by 11.4% year-on-year to ¥8,345 million.
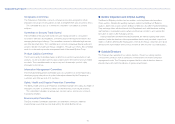
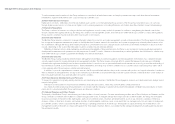
Net sales: ¥45,924 million
Net sales dropped 13.0% year-on-year to ¥45,924 million due primarily to the after effects of the Great East
Japan Earthquake.
Operating loss: ¥19 million
Despite improving on the previous year’s loss thanks to reductions in selling, general and administrative
expenses, a decline in sales resulted in a second consecutive operating loss.
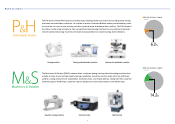
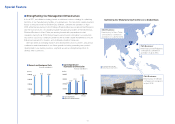
Machinery & Solution (M&S) Business
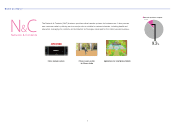
Network & Contents (N&C) Business
* Quantitative sales data for each market
has been omitted for the Network &
Contents Business because a majority of
its sales originate from the Japan market.
Asia & Others
66.3%
Japan
21.4%
The Americas
6.5% Europe
5.8%
31.8
66.4 70.4
8.3
7.5
-2.7
0
3
-3
6
9
12
15
0
15
30
45
60
75
201220112010
Net Sales (left) / Operating Income (Loss) (right)
(¥ billion) (¥ billion)
Net Sales by Market
(FY2011)
Industrial sewing machines
Machine tools
Fiscal years ended March 31
32.7
52.8 45.9
0.6
-2.7
-0.0 0
3
-3
6
9
12
15
0
15
30
45
60
75
201220112010
(¥ billion) (¥ billion)
Fiscal years ended March 31
Net Sales (left) / Operating Income (Loss) (right)
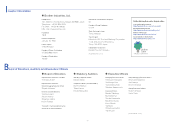
KE-430F
Electronic direct drive lockstitch bar tacker
JOYSOUND f1
Online karaoke system
TC-S2DN
CNC tapping center
JOYBEAT
Fitness lesson system for fitness studio
Machinery & Solution Network & Contents
Line-up of
products and services