Brother International 2012 Annual Report Download - page 19
Download and view the complete annual report
Please find page 19 of the 2012 Brother International annual report below. You can navigate through the pages in the report by either clicking on the pages listed below, or by using the keyword search tool below to find specific information within the annual report.-
 1
1 -
2
-
3
-
4
-
5
-
6
-
7
-
8
-
 9
9 -
 10
10 -
 11
11 -
 12
12 -
 13
13 -
 14
14 -
 15
15 -
 16
16 -
 17
17 -
 18
18 -
 19
19 -
 20
20 -
 21
21 -
 22
22 -
 23
23 -
 24
24 -
 25
25 -
 26
26 -
 27
27 -
 28
28 -
 29
29 -
30
-
31
-
32
-
33
-
34
-
35
-
36
-
37
-
38
-
39
-
40
-
41
-
42
-
43
-
44
-
45
-
46
-
47
-
48
-
49
-
50
-
51
-
52
-
53
-
54
-
55
-
56
-
57
-
58
-
59
-
60
-
61
 |
 |

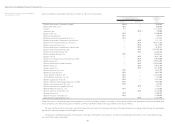
18
Business Overview
Looking back at the state of the economy during the period under review, uncertainty heightened toward the future of the global economy due to the European sovereign
debt crisis and a slowdown in the real economy resulting from monetary tightening measures initiated by emerging countries. In Japan, the continuing sharp appreciation of
the yen coupled with impacts felt from natural disasters, such as disruptions in the supply chain in the wake of the Great East Japan Earthquake, power supply restrictions
resulting from the nuclear accident, and flooding in Thailand, made the period one of the most challenging on record for Japan’s manufacturing industry.
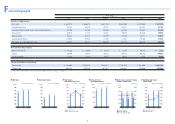
Under these circumstances, the Brother Group’s consolidated net sales decreased 1.1% over the previous year to ¥497,390 million due primarily to the effect of
exchange rates, despite robust demand seen for communications and printing equipment and machine tools. Operating income fell 5.3% compared to the previous fiscal
year to ¥34,183 million owing to an increase in research and development costs as well as the negative effect of exchange rates, despite a major improvement in earnings
seen from the online karaoke business within the Network & Contents Business. Net income dropped 25.6% year-on-year to ¥19,525 million attributed to an increase in
corporate income tax and other taxes owing to deferred tax accounting and a decrease in foreign exchange profits.
Performance by Business Segment
For details about performance by business segment, please see “Review of Operations,” Pages 13-14.
Fund Procurement, Liquidity and Cash Flows
The Brother Group’s financial policies ensure flexible and efficient funding and maintain an appropriate level of liquidity for current and future operating activities. In accor-
dance with these policies, we have created and operated a cash management system to optimize the group-wide use of cash held by individual companies. We also
maintain open commitment lines of credit with several banking institutions to complement existing liquidity on hand. Through these measures, we have established a
system to correct the uneven distribution of funds and minimize the overall borrowing needs of the Group.
Liquidity Management
The Group’s liquidity on hand consists of cash and cash equivalents and the unused portion of open commitment lines of credit. As of March 31, 2012, cash and cash
equivalents totaled ¥58,732 million.
We maintain open commitment lines of credit with several financial institutions for a combined amount of ¥30,000 million, and the entire amount in open commitment
lines of credit was unused as of March 31, 2012. This total plus cash and cash equivalents was ¥88,732 million at fiscal year-end. Taking into consideration seasonal
funding requirements, debt payable within one year and business environment risks, we believe that we have sufficient liquidity on hand to support our operations through a
whole year.
Fund Procurement
As a basic rule, we procure working capital and other short-term funding in short-term borrowings within one year that is funded with local currency. The basic policy on
long-term funding for manufacturing facilities is that funds should come from internal reserves, fixed-rate long-term debt and corporate bonds. As of March 31, 2012, short-
term borrowings stood at ¥4,467 million, primarily denominated in yen. The balance of long-term debt was ¥500 million, all procured in fixed-rate debt procured in yen.
Outstanding corporate bonds (including current portion of corporate bonds within one year) stood at ¥15,000 million.
We have obtained credit ratings from Rating and Investment Information, Inc. (R&I). As of March 31, 2012, R&I assigned the Group’s long-term bonds and issuer credit
“A” ratings and its commercial paper an “a-1” rating. We consider consistent ratings important in maintaining our access to credit and capital markets.
The Brother Group believes that its liquidity on hand, including open commitment lines of credit, and sound corporate finance structure, on top of its ability to generate
cash flows from operating activities, make it possible to secure working capital as well as funds for capital investment and R&D investment to maintain the Group’s growth.
Cash Flows
Cash flows from operating activities
Net cash provided by operating activities amounted to ¥39,327 million, ¥10,162 million less than ¥49,489 million in the previous year. This was primarily because of
increases in trade notes and accounts receivable and income taxes-paid, although income before income taxes and minority interests stayed at the same level as in the
previous year.
Cash flows from investment activities
Net cash used in investing activities amounted to ¥30,758 million, ¥10,715 million more than ¥20,043 million used in the previous year, reflecting increases in disburse-
ment for purchases of property, plant and equipment and disbursement for purchases of investment in affiliates.
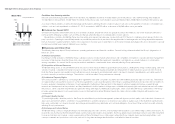
Management’s Discussion and Analysis
Net sales (left)
Operating income (right)
Net income (right)
Operating Results
(¥ billion) (¥ billion)
446.3
502.8497.4
0
100
200
300
400
500
600
201220112010 0
10
20
30
40
50
60
34.2
19.6
26.6 26.2
36.1
19.5
Fiscal years ended March 31
Cash and Cash Equivalents,
End of Year
(¥ billion)
49.0
65.1
58.7
As of March 31
0
20
40
60
80
100
201220112010
Interest-bearing Debt
(¥ billion)
30.4
31.5
23.1
As of March 31
0
10
20
30
40
201220112010