Brother International 2012 Annual Report Download - page 14
Download and view the complete annual report
Please find page 14 of the 2012 Brother International annual report below. You can navigate through the pages in the report by either clicking on the pages listed below, or by using the keyword search tool below to find specific information within the annual report.-
 1
1 -
2
-
3
-
 4
4 -
 5
5 -
 6
6 -
 7
7 -
 8
8 -
 9
9 -
 10
10 -
 11
11 -
 12
12 -
 13
13 -
 14
14 -
 15
15 -
 16
16 -
 17
17 -
 18
18 -
 19
19 -
 20
20 -
 21
21 -
 22
22 -
 23
23 -
 24
24 -
25
-
26
-
27
-
28
-
29
-
30
-
31
-
32
-
33
-
34
-
35
-
36
-
37
-
38
-
39
-
40
-
41
-
42
-
43
-
44
-
45
-
46
-
47
-
48
-
49
-
50
-
51
-
52
-
53
-
54
-
55
-
56
-
57
-
58
-
59
-
60
-
61
 |
 |

13
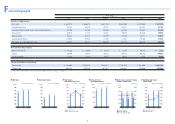
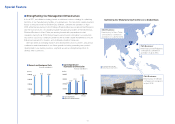
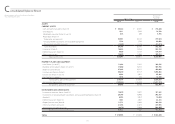
Review of Operations
Net sales: ¥337,226 million
Communications and printing equipment
Despite steady performance in the Americas and an increase in sales denominated in local currencies, the
negative effect of exchange rates caused net sales to decline 1.1% year-on-year to ¥300,125 million.
Electronic stationery
Despite the negative effect of exchange rates, each region saw robust sales and, as a result, overall net sales
rose 0.7% over the previous fiscal year to ¥37,100 million.
Operating income: ¥21,978 million
Although some positive effects were found such as improved sales mix, the negative effect of exchange rates,
rising costs, including for raw materials, and an increase in selling, general and administrative expenses caused
operating income to drop 18.9% year-on-year to ¥21,977 million.
Net sales: ¥30,706 million
In spite of the negative effect of exchange rates, firm sales of mid- to high-end models mainly in the Americas
helped increase overall net sales 4.3% year-on-year to ¥30,706 million.
Operating income: ¥2,604 million
Despite a boost from increased sales, the negative effect of exchange rates and rising costs for raw materials,
drove operating income down 11.4% compared to the previous fiscal year to ¥2,604 million.
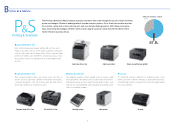
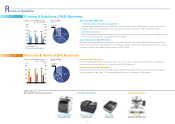
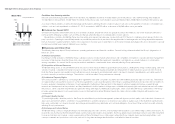
Printing & Solutions (P&S) Business
27.9 29.4
1.8
2.9
30.7
2.6
0
10
20
30
40
0
1.5
3.0
4.5
6.0
Fiscal years ended March 31
201220112010
Net Sales (left) / Operating Income (right) Net Sales by Market
(FY2011)
(¥ billion) (¥ billion)
The Americas
48.1%
Europe
22.7%
Japan
17.2%
Asia & Others
12.1%
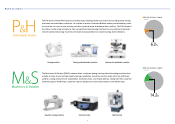
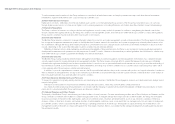
Personal & Home (P&H) Business
Electronic stationery
Communications and printing equipment
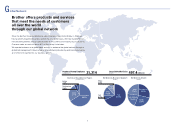
(¥ billion) (¥ billion)
341.5 340.2 337.2
Fiscal years ended March 31 (FY2011)
26.4 27.1 22.0
Net Sales (left) / Operating Income (right)
0
100
200
300
400
500
201220112010 0
15
30
45
60
75
Japan
10.9%
The Americas
36.2%
Europe
37.5%
Asia & Others
15.4%
Net Sales by Market
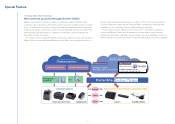
MFC-9970CDW
Color laser All-in-One
MFC-J6710DW
A3 Color All-in-One
PT-2730
Labeling system
PR-1000e
Commercial embroidery machine
Printing & Solutions Personal & Home
Line-up of
products and services