Brother International 2012 Annual Report Download - page 36
Download and view the complete annual report
Please find page 36 of the 2012 Brother International annual report below. You can navigate through the pages in the report by either clicking on the pages listed below, or by using the keyword search tool below to find specific information within the annual report.-
 1
1 -
2
-
3
-
4
-
5
-
6
-
7
-
8
-
9
-
10
-
11
-
12
-
13
-
14
-
15
-
16
-
17
-
18
-
19
-
20
-
21
-
22
-
23
-
24
-
25
-
 26
26 -
 27
27 -
 28
28 -
 29
29 -
 30
30 -
 31
31 -
 32
32 -
 33
33 -
 34
34 -
 35
35 -
 36
36 -
 37
37 -
 38
38 -
 39
39 -
 40
40 -
 41
41 -
 42
42 -
 43
43 -
 44
44 -
 45
45 -
 46
46 -
47
-
48
-
49
-
50
-
51
-
52
-
53
-
54
-
55
-
56
-
57
-
58
-
59
-
60
-
61
 |
 |
35
Notes to Consolidated Financial Statements
Brother Industries, Ltd. and Consolidated Subsidiaries
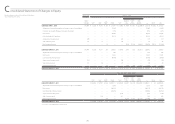
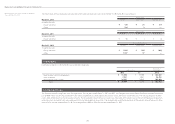
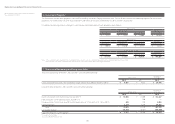
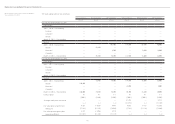
Year ended March 31, 2012 The information of the available-for-sale securities which were sold during the years ended March 31, 2012 and 2011 was as follows:
March 31, 2012
Millions of Yen
Proceeds Realized Gains Realized Losses
Available-for-sale:
Equity securities ¥ 130 ¥ 21 ¥ (17)
Other 126 3 —
March 31, 2011
Millions of Yen
Proceeds Realized Gains Realized Losses
Available-for-sale:
Equity securities ¥ 56 ¥ 1 ¥ (3)
March 31, 2012
Thousands of U.S. Dollars
Proceeds Realized Gains Realized Losses
Available-for-sale:
Equity securities $ 1,585 $ 256 $ (207)
Other 1,537 37 —
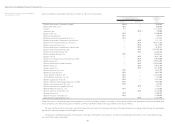
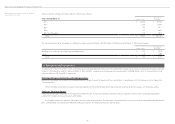
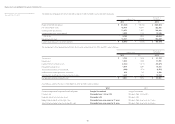
4. Inventories
Inventories at March 31, 2012 and 2011 consisted of the following:
Millions of Yen
Thousands of
U.S. Dollars
2012 2011 2012
Merchandise and finished products ¥ 51,960 ¥ 49,500 $ 633,659
Work in process 7,937 8,067 96,793
Raw materials and supplies 16,587 14,689 202,280
Total ¥ 76,484 ¥ 72,256 $ 932,732
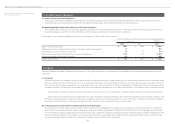
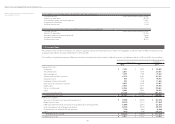
5. Long-lived Assets
The Group reviewed its long-lived assets for impairment. For the years ended March 31, 2012 and 2011, the Company and consolidated subsidiaries recorded impairment
loss of ¥609 million ($7,427 thousand) and ¥1,473 million, respectively, as other expense, for business assets, idle assets and rental assets. The carrying amounts of these
assets were written down to the recoverable amount. The recoverable amount of business assets was measured at the value in use or the net selling price at disposition,
while idle assets and rental assets were measured at the net selling price at disposition. The discount rates used for computation of the present value of future cash flows
were 8.1% for the year ended March 31, 2012 and ranged from 4.60% to 5.08% for the year ended March 31, 2011.