Brother International 2012 Annual Report Download - page 26
Download and view the complete annual report
Please find page 26 of the 2012 Brother International annual report below. You can navigate through the pages in the report by either clicking on the pages listed below, or by using the keyword search tool below to find specific information within the annual report.-
 1
1 -
2
-
3
-
4
-
5
-
6
-
7
-
8
-
9
-
10
-
11
-
12
-
13
-
14
-
15
-
 16
16 -
 17
17 -
 18
18 -
 19
19 -
 20
20 -
 21
21 -
 22
22 -
 23
23 -
 24
24 -
 25
25 -
 26
26 -
 27
27 -
 28
28 -
 29
29 -
 30
30 -
 31
31 -
 32
32 -
 33
33 -
 34
34 -
 35
35 -
 36
36 -
37
-
38
-
39
-
40
-
41
-
42
-
43
-
44
-
45
-
46
-
47
-
48
-
49
-
50
-
51
-
52
-
53
-
54
-
55
-
56
-
57
-
58
-
59
-
60
-
61
 |
 |

25
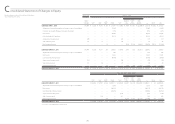
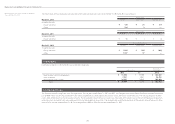
Consolidated Statement of Changes in Equity
Brother Industries, Ltd. and Consolidated Subsidiaries
Year ended March 31, 2012 Thousands Millions of Yen
Accumulated other comprehensive income (loss)
Number of
Shares of
Common Stock
Outstanding
Common
Stock
Capital
Surplus
Stock
Acquisition
Rights
Retained
Earnings
Treasury
Stock
Unrealized
Gain (Loss) on
Available-for-
sale
Securities
Deferred
(Loss) Gain
Under
Hedge
Accounting
Foreign
Currency
Translation
Adjustments Total
Minority
Interests
Total
Equity
BALANCE, APRIL 1, 2010 267,634 ¥ 19,210 ¥ 16,149 ¥ 287 ¥ 211,647 ¥ (11,702) ¥ 3,098 ¥1,101 ¥(27,280) ¥212,510 ¥ 1,022 ¥ 213,532
Adjustment of retained earnings due to change in scope of consolidation
— — — — (1,246) — — — — (1,246) — (1,246)
Decrease due to split-off type of corporate divestiture — — — — (375) — — — — (375) — (375)
Net income — — — — 26,238 — — — — 26,238 — 26,238
Cash dividends, ¥ 22 per share — — — — (5,912) — — — — (5,912) — (5,912)
Acquisition of treasury stock (20) — — — — (17) — — — (17) — (17)
Sale of treasury stock 34 — 8 — — 30 — — — 38 — 38
Net change in the year — — — 52 — — (653) (1,192) (8,981) (10,774) (1,015) (11,789)
BALANCE, MARCH 31, 2011 267,648 19,210 16,157 339 230,352 (11,689) 2,445 (91) (36,261) 220,462 7 220,469
Adjustment of retained earnings due to change in scope of consolidation
— — — — 298 — — — — 298 — 298
Net income — — — — 19,525 — — — — 19,525 — 19,525
Cash dividends, ¥ 24 per share — — — — (6,450) — — — — (6,450) — (6,450)
Acquisition of treasury stock (14) — — — — (10) — — — (10) — (10)
Sale of treasury stock 35 — (6) — — 26 — — — 20 — 20
Net change in the year — — — 81 — — (268) (94) (2,143) ( 2,424) (3) ( 2,427)
BALANCE, MARCH 31, 2012 267,669 ¥ 19,210 ¥ 16,151 ¥ 420 ¥ 243,725 ¥ (11,673) ¥ 2,177 ¥ (185) ¥(38,404) ¥ 231,421 ¥ 4 ¥ 231,425
Thousands of U.S. Dollars (Note 1)
Accumulated other comprehensive income (loss)
Common
Stock
Capital
Surplus
Stock
Acquisition
Rights
Retained
Earnings
Treasury
Stock
Unrealized
Gain (Loss) on
Available-for-
sale
Securities
Deferred
Loss
Under
Hedge
Accounting
Foreign
Currency
Translation
Adjustments Total
Minority
Interests
Total
Equity
BALANCE, MARCH 31, 2011 $ 234,268 $ 197,037 $ 4,134 $2,809,171 $ (142,549) $29,817 $ (1,110) $ (442,207) $2,688,561 $ 85 $ 2,688,646
Adjustment of retained earnings due to change in scope of consolidation
— — — 3,634 — — — — 3,634 — 3,634
Net income — — — 238,110 — — — — 238,110 — 238,110
Cash dividends, $ 0.29 per share — — — (78,659) — — — — (78,659) —(78,659)
Acquisition of treasury stock — — — — (122) — — — (122) —(122)
Sale of treasury stock — (74) — — 317 — — — 243 — 243
Net change in the year — — 988 — — (3,268) (1,146) (26,134) ( 29,560) (36) ( 29,596)
BALANCE, MARCH 31, 2012 $ 234,268 $ 196,963 $ 5,122 $2,972,256 $ (142,354) $26,549 $(2,256) $ (468,341) $2,822,207 $ 49 $2,822,256
See notes to consolidated financial statements.