Brother International 2012 Annual Report Download - page 57
Download and view the complete annual report
Please find page 57 of the 2012 Brother International annual report below. You can navigate through the pages in the report by either clicking on the pages listed below, or by using the keyword search tool below to find specific information within the annual report.-
 1
1 -
2
-
3
-
4
-
5
-
6
-
7
-
8
-
9
-
10
-
11
-
12
-
13
-
14
-
15
-
16
-
17
-
18
-
19
-
20
-
21
-
22
-
23
-
24
-
25
-
26
-
27
-
28
-
29
-
30
-
31
-
32
-
33
-
34
-
35
-
36
-
37
-
38
-
39
-
40
-
41
-
42
-
43
-
44
-
45
-
46
-
 47
47 -
 48
48 -
 49
49 -
 50
50 -
 51
51 -
 52
52 -
 53
53 -
 54
54 -
 55
55 -
 56
56 -
 57
57 -
 58
58 -
 59
59 -
 60
60 -
 61
61
 |
 |

56
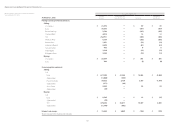
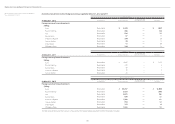
Notes to Consolidated Financial Statements
Brother Industries, Ltd. and Consolidated Subsidiaries
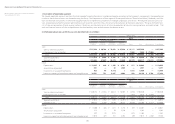
Year ended March 31, 2012 1. Description of reportable segments
The Group’s reportable segments are those for which separate financial information is available and regular evaluation by the Company’s management is being performed
in order to decide how resources are allocated among the Group. The Group consists of four segments “Printing and Solutions,” “Personal and Home,” “Machinery and Solu-
tion” and “Network and Contents,” in which the Group formulates and implements comprehensive strategies of products and services. “Printing and Solutions” consists of
sales and production of communication printing device such as printers and All-in-Ones, and of sales and production of electronic stationeries. “Personal and Home” con-
sists of sales and production of home sewing machines. “Machinery and Solution” consists of sales and production of industrial sewing machines and machine tools. “Net-
work and Contents” consists of sales and production of online karaoke system, and of contents distribution services.
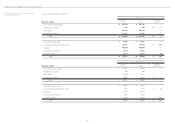
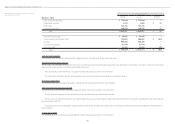
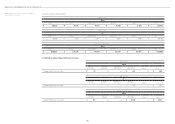
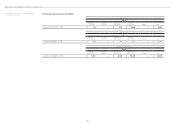
2. Information about sales, profit (loss), assets and other items is as follows:
Millions of Yen
2012
Reportable segment
Printing and
Solutions
Personal
and Home
Machinery
and Solution
Network
and Contents Others Total
Reconciliations
Consolidated
Sales
Sales to external customers ¥337,226 ¥ 30,706 ¥ 70,423 ¥ 45,924 ¥ 13,111 ¥497,390 — ¥497,390
Intersegment sales or transfers — — — — 7,556 7,556 ¥ (7,556) —
Total ¥337,226 ¥ 30,706 ¥ 70,423 ¥ 45,924 ¥ 20,667 ¥504,946 ¥ (7,556) ¥497,390
Segment profit/(loss) ¥ 21,978 ¥ 2,604 ¥ 8,345 ¥ (19) ¥ 1,428 ¥ 34,336 ¥ (153) ¥ 34,183
Segment assets 218,486 21,489 55,274 31,869 58,199 385,317 (14,411) 370,906
Other:
Depreciation ¥ 15,425 ¥ 680 ¥ 1,332 ¥ 4,761 ¥ 871 ¥ 23,069 — ¥ 23,069
Amortization of goodwill 201 — 20 1,466 — 1,687 — 1,687
Investments in associated companies 425 46 9,772 1 1,416 11,660 — 11,660
Increase in property, plant and equipment and intangible assets
16,521 721 2,667 4,008 203 24,120 ¥ 3,746 27,866
Millions of Yen
2011
Reportable segment
Printing and
Solutions
Personal
and Home
Machinery
and Solution
Network
and Contents Others Total
Reconciliations
Consolidated
Sales
Sales to external customers ¥ 340,194 ¥ 29,433 ¥ 66,412 ¥ 52,805 ¥ 13,986 ¥ 502,830 — ¥ 502,830
Intersegment sales or transfers — — — — 5,876 5,876 ¥ (5,876) —
Total ¥ 340,194 ¥ 29,433 ¥ 66,412 ¥ 52,805 ¥ 19,862 ¥ 508,706 ¥ (5,876) ¥ 502,830
Segment profit/(loss) ¥ 27,093 ¥ 2,942 ¥ 7,490 ¥ (2,731) ¥ 1,298 ¥ 36,092 — ¥ 36,092
Segment assets 206,559 17,398 54,104 38,427 63,380 379,868 ¥ (7,222) 372,646
Other:
Depreciation ¥ 15,400 ¥ 626 ¥ 1,371 ¥ 5,735 ¥ 895 ¥ 24,027 — ¥ 24,027
Amortization of goodwill 213 — 20 2,336 — 2,569 — 2,569
Investments in associated companies 422 93 9,575 — 1,375 11,465 — 11,465
Increase in property, plant and equipment and intangible assets
11,078 678 951 3,922 390 17,019 ¥ 2,769 19,788