Brother International 2012 Annual Report Download - page 37
Download and view the complete annual report
Please find page 37 of the 2012 Brother International annual report below. You can navigate through the pages in the report by either clicking on the pages listed below, or by using the keyword search tool below to find specific information within the annual report.-
 1
1 -
2
-
3
-
4
-
5
-
6
-
7
-
8
-
9
-
10
-
11
-
12
-
13
-
14
-
15
-
16
-
17
-
18
-
19
-
20
-
21
-
22
-
23
-
24
-
25
-
26
-
 27
27 -
 28
28 -
 29
29 -
 30
30 -
 31
31 -
 32
32 -
 33
33 -
 34
34 -
 35
35 -
 36
36 -
 37
37 -
 38
38 -
 39
39 -
 40
40 -
 41
41 -
 42
42 -
 43
43 -
 44
44 -
 45
45 -
 46
46 -
 47
47 -
48
-
49
-
50
-
51
-
52
-
53
-
54
-
55
-
56
-
57
-
58
-
59
-
60
-
61
 |
 |
36
Notes to Consolidated Financial Statements
Brother Industries, Ltd. and Consolidated Subsidiaries
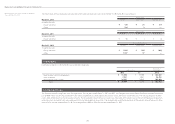
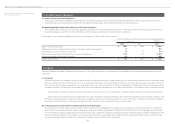
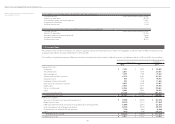
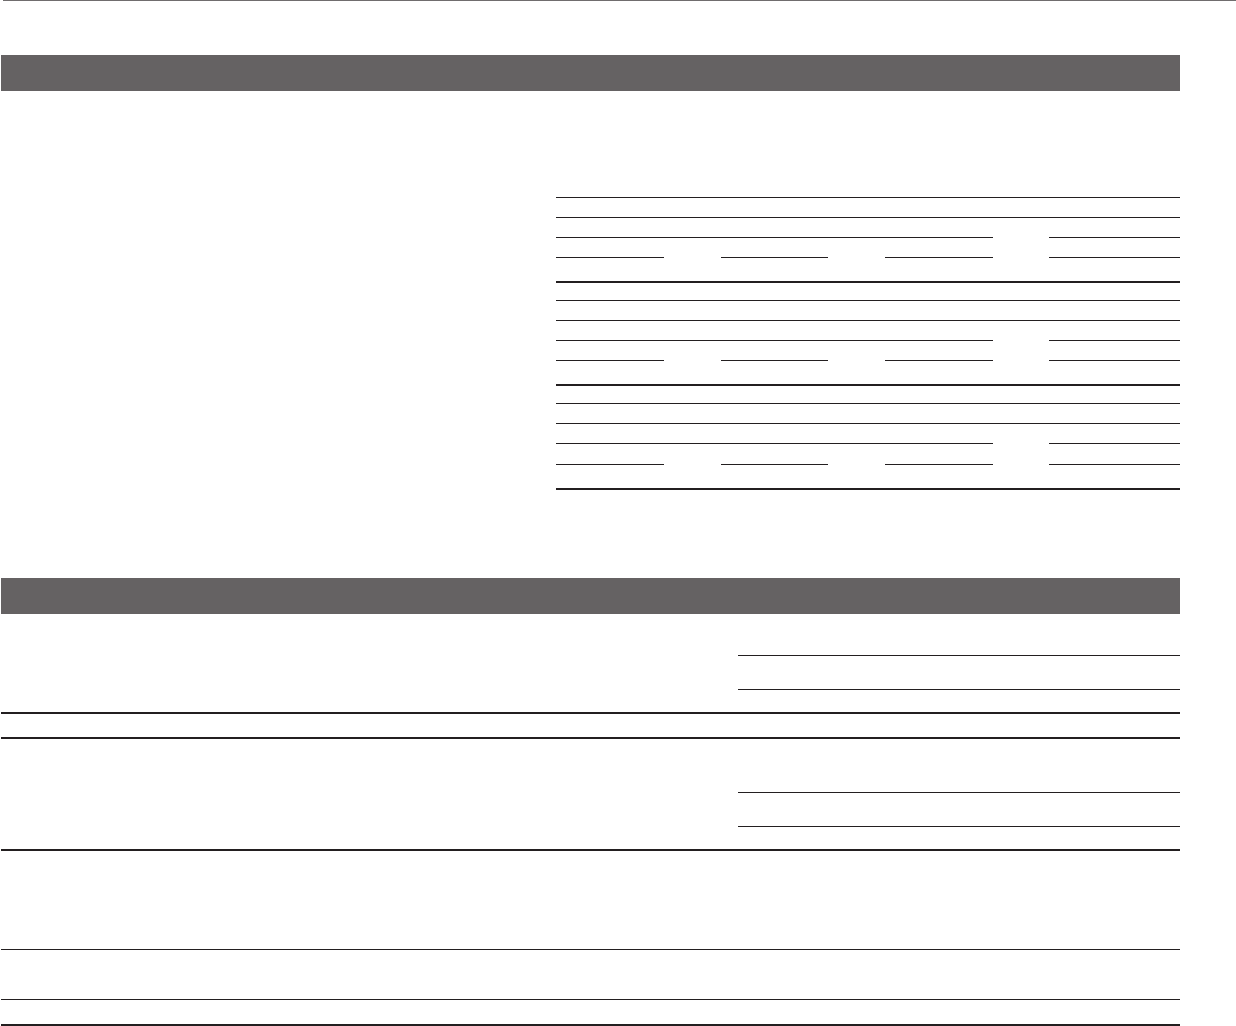
Year ended March 31, 2012 6. Investment Property
The Group owns certain rental properties such as office buildings and land in Nagoya and other areas. The net of rental income and operating expenses for those rental
properties was ¥1,053 million ($12,841 thousand) and ¥1,230 million for the years ended March 31, 2012 and 2011, respectively.
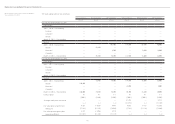
In addition, the carrying amounts, changes in such balances and market prices of such properties are as follows:
Millions of Yen
Carrying amount Fair value
April 1, 2011 Decrease March 31, 2012 March 31, 2012
¥ 8,797 ¥ (935) ¥ 7,862 ¥ 15,515
Millions of Yen
Carrying amount Fair value
April 1, 2010 Decrease March 31, 2011 March 31, 2011
¥ 10,053 ¥ (1,256) ¥ 8,797 ¥ 16,862
Thousands of U.S. Dollars
Carrying amount Fair value
April 1, 2011 Decrease March 31, 2012 March 31, 2012
$ 107,280 $ (11,402) $ 95,878 $ 189,207
Notes: 1) The carrying amount recognized in the consolidated balance sheets is net of accumulated depreciation and accumulated impairment losses, if any.
2) The fair value of properties is mainly measured by the Group in accordance with its Real-estate Appraisal Standard.
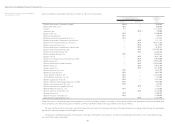
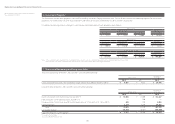
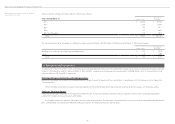
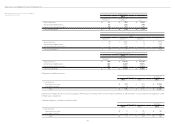
7. Short-term Borrowings and Long-term Debt
Short-term borrowings at March 31, 2012 and 2011 consisted of the following:
Millions of Yen
Thousands of
U.S. Dollars
2012 2011 2012
Loans principally from banks with weighted-average interest rates of 0.63% (0.56% in 2011) ¥ 4,467 ¥ 8,637 $ 54,476
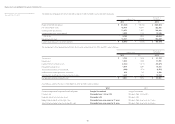
Long-term debt at March 31, 2012 and 2011 consisted of the following:
Millions of Yen
Thousands of
U.S. Dollars
2012 2011 2012
Fourth unsecured 1.68% domestic bonds, due 2012 *1 ¥ 15,000 ¥ 15,000 $ 182,927
Fifth unsecured 1.97% domestic bonds, due 2011 *2 —500 —
Unsecured loans from a bank, due 2018 with interest rates of 1.73% and 1.61 (1.73% in 2011) 500 250 6,098
Lease obligations 3,174 5,978 38,707
Total 18,674 21,728 227,732
Less current portion (16,363) (3,422) (199,549)
Long-term debt, less current portion ¥ 2,311 ¥ 18,306 $ 28,183
*1: Issued by the Company
*2: Issued by Brother Real Estate, Ltd.