Brother International 2012 Annual Report Download - page 27
Download and view the complete annual report
Please find page 27 of the 2012 Brother International annual report below. You can navigate through the pages in the report by either clicking on the pages listed below, or by using the keyword search tool below to find specific information within the annual report.-
 1
1 -
2
-
3
-
4
-
5
-
6
-
7
-
8
-
9
-
10
-
11
-
12
-
13
-
14
-
15
-
16
-
 17
17 -
 18
18 -
 19
19 -
 20
20 -
 21
21 -
 22
22 -
 23
23 -
 24
24 -
 25
25 -
 26
26 -
 27
27 -
 28
28 -
 29
29 -
 30
30 -
 31
31 -
 32
32 -
 33
33 -
 34
34 -
 35
35 -
 36
36 -
 37
37 -
38
-
39
-
40
-
41
-
42
-
43
-
44
-
45
-
46
-
47
-
48
-
49
-
50
-
51
-
52
-
53
-
54
-
55
-
56
-
57
-
58
-
59
-
60
-
61
 |
 |

26
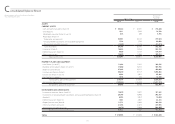
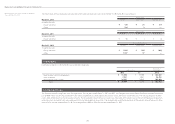
Consolidated Statement of Cash Flows
Brother Industries, Ltd. and Consolidated Subsidiaries
Year ended March 31, 2012
Millions of Yen
Thousands of
U.S. Dollars
(Note 1)
2012 2011 2012
OPERATING ACTIVITIES:
Income before income taxes and minority interests ¥ 34,108 ¥ 34,062 $ 415,951
Adjustments for:
Income taxes - paid (15,972) (9,077) (194,780)
Depreciation and amortization 23,069 24,027 281,329
Loss on impairment of long-lived assets 609 1,473 7,427
Amortization of goodwill 1,687 2,569 20,573
Loss on sales and disposals of property, plant and equipment, net 546 661 6,659
Foreign exchange loss 797 1,157 9,720
Changes in assets and liabilities:
(Increase) decrease in trade notes and accounts receivable (3,149) 1,094 (38,402)
Increase in inventories (5,424) (11,800) (66,146)
Increase in trade notes and accounts payable 2,327 977 28,378
Increase (decrease) in accrued expenses 1,487 (232) 18,134
(Decrease) increase in liability for retirement benefits (491) 629 (5,988)
Increase in allowance for doubtful accounts 913 776 11,134
Decrease in liability for warranty reserve (983) (334) (11,988)
Other - net (197) 3,507 (2,403)
Total adjustments 5,219 15,427 63,647
Net cash provided by operating activities 39,327 49,489 479,598
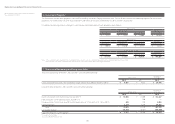
INVESTING ACTIVITIES:
Proceeds from sales of property, plant and equipment 1,113 2,640 13,573
Proceeds from sales of investment securities 257 56 3,134
Proceeds from collection of loans 10 816 122
Disbursement for purchases of property, plant and equipment (21,130) (16,741) (257,683)
Disbursement for purchases of investment securities (67) (700) (817)
Disbursement for purchases of intangible assets (6,027) (4,162) (73,500)
Disbursement for purchases of affiliates' shares (1,929) (1,281) (23,524)
Disbursement for purchases of investment in affiliates (2,463) (344) (30,037)
Other - net (522) (327) (6,366)
Net cash used in investing activities (30,758) (20,043) (375,098)
FINANCING ACTIVITIES:
(Decrease) increase in short-term borrowings, net (4,189) 2,321 (51,085)
Repayments of long-term debt —(5,107) —
Repayments of lease obligations (3,227) (2,493) (39,354)
Cash dividends paid (6,450) (5,912) (78,659)
Increase in treasury stock, net (1) (9) (12)
Other - net (251) 250 (3,061)
Net cash used in financing activities (14,118) (10,950) (172,171)
EFFECT OF FOREIGN CURRENCY EXCHANGE RATE CHANGES ON CASH AND CASH EQUIVALENTS (1,614) (2,561) (19,683)
NET (DECREASE) INCREASE IN CASH AND CASH EQUIVALENTS (7,163) 15,935 (87,354)
CASH AND CASH EQUIVALENTS OF NEWLY CONSOLIDATED SUBSIDIARIES 794 135 9,683
CASH AND CASH EQUIVALENTS, BEGINNING OF YEAR 65,101 49,031 793,915
CASH AND CASH EQUIVALENTS, END OF YEAR ¥ 58,732 ¥65,101 $ 716,244
See notes to consolidated financial statements.