Brother International 2011 Annual Report Download - page 55
Download and view the complete annual report
Please find page 55 of the 2011 Brother International annual report below. You can navigate through the pages in the report by either clicking on the pages listed below, or by using the keyword search tool below to find specific information within the annual report.-
 1
1 -
2
-
3
-
4
-
5
-
6
-
7
-
8
-
9
-
10
-
11
-
12
-
13
-
14
-
15
-
16
-
17
-
18
-
19
-
20
-
21
-
22
-
23
-
24
-
25
-
26
-
27
-
28
-
29
-
30
-
31
-
32
-
33
-
34
-
35
-
36
-
37
-
38
-
39
-
40
-
41
-
42
-
43
-
44
-
 45
45 -
 46
46 -
 47
47 -
 48
48 -
 49
49 -
 50
50 -
 51
51 -
 52
52 -
 53
53 -
 54
54 -
 55
55 -
 56
56 -
 57
57 -
 58
58 -
 59
59 -
 60
60
 |
 |
53
Brother Annual Report 2011
For the year ended March 31, 2010
The Group operates in the following industries:
“Printing & Solutions” consists of sales and production of printers, multi-function printers, fax machines, electronic stationeries and
typewriters.
“Personal & Home” consists of sales and production of home sewing machines.
“Machinery & Solution” consists of sales and production of industrial sewing machines and machine tools.
“Others” consists of online karaoke, information distribution services for cellular phones, real estate, leasing parts and other areas of business.
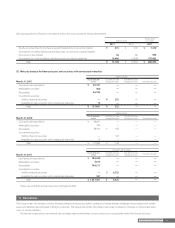
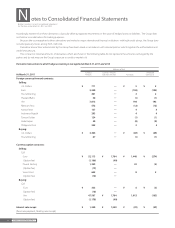
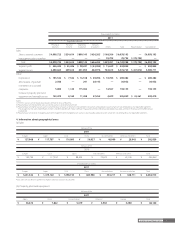
Information about business segments, geographical segments and sales to foreign customers of the Group for the year ended March 31, 2010
is as follows:
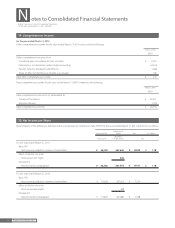
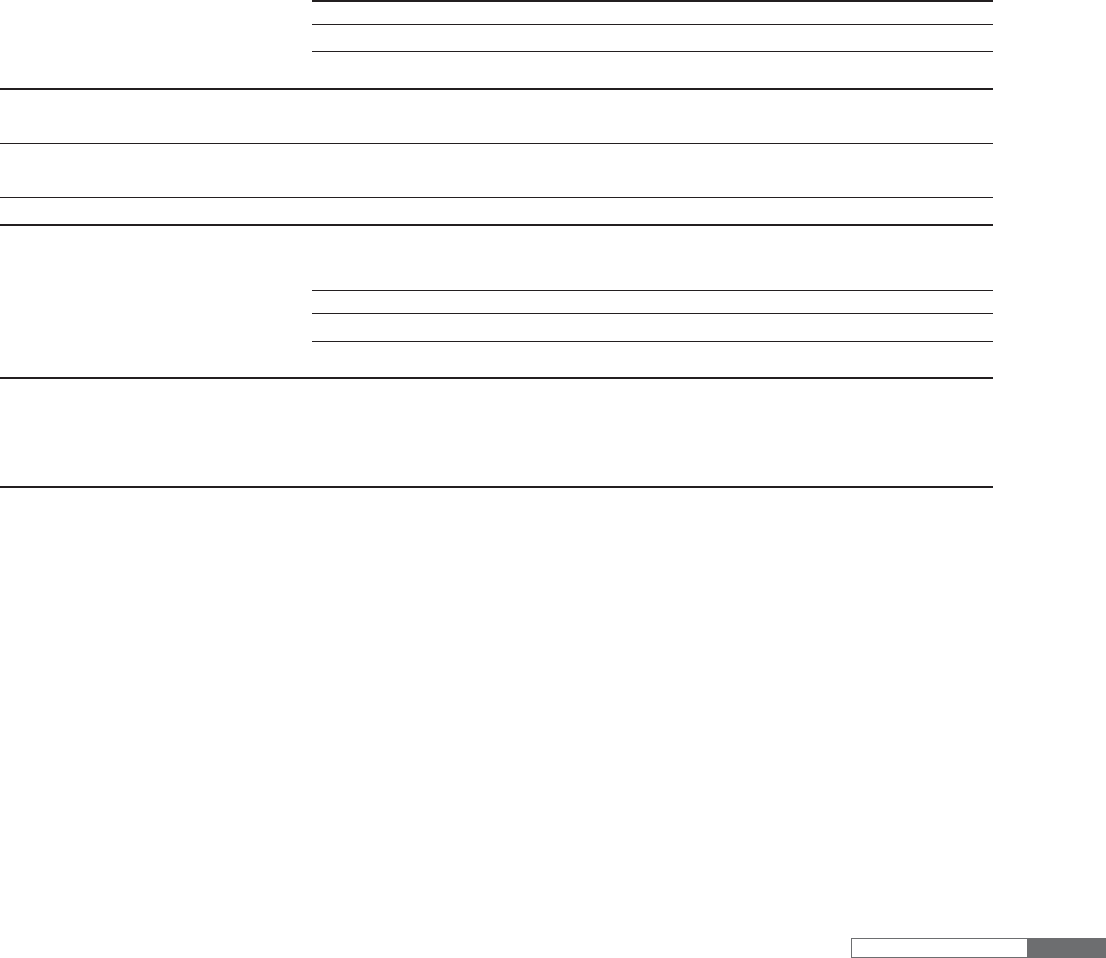
(1) Business Segments
Information about business segments for the year ended March 31, 2010 is summarized as follows:
(a) Sales, operating expenses and operating income (loss) :
Millions of Yen
2010
Printing
& Solutions
Personal
& Home
Machinery
& Solution Others
Eliminations
/Corporate Consolidated
Sales to customers ¥ 341,470 ¥ 27,948 ¥ 31,791 ¥ 45,060 — ¥ 446,269
Intersegment sales — — — 7,909 ¥ (7,909) —
Total sales 341,470 27,948 31,791 52,969 (7,909) 446,269
Operating expenses 315,042 26,151 34,464 51,884 (7,909) 419,632
Operating income (loss) ¥ 26,428 ¥ 1,797 ¥ (2,673) ¥ 1,085 — ¥ 26,637
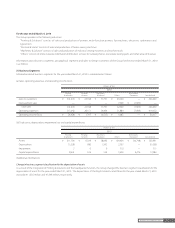
(b) Total assets, depreciation, impairment loss and capital expenditures:
Millions of Yen
2010
Printing
& Solutions
Personal
& Home
Machinery
& Solution Others
Eliminations
/Corporate Consolidated
Assets: ¥ 211,709 ¥ 17,509 ¥ 38,092 ¥ 109,429 ¥ (10,748) ¥ 365,991
Depreciation: 15,528 680 1,293 3,527 — 21,028
Impairment: 3 0 0 312 — 315
Capital expenditures: 8,641 532 534 3,299 4,476 17,482
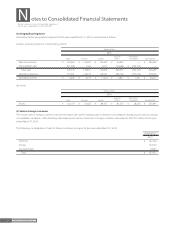
(Additional information)
Change in business segment classification for the depreciation of assets
As a result of the integration of Printing & Solutions and the headquarter function, the Group changed the business segment classification for the
depreciation of assets for the year ended March 31, 2010. The depreciation of Printing & Solutions and Others for the year ended March 31, 2010
would be ¥11,656 million and ¥7,399 million, respectively,