Brother International 2011 Annual Report Download - page 44
Download and view the complete annual report
Please find page 44 of the 2011 Brother International annual report below. You can navigate through the pages in the report by either clicking on the pages listed below, or by using the keyword search tool below to find specific information within the annual report.-
 1
1 -
2
-
3
-
4
-
5
-
6
-
7
-
8
-
9
-
10
-
11
-
12
-
13
-
14
-
15
-
16
-
17
-
18
-
19
-
20
-
21
-
22
-
23
-
24
-
25
-
26
-
27
-
28
-
29
-
30
-
31
-
32
-
33
-
 34
34 -
 35
35 -
 36
36 -
 37
37 -
 38
38 -
 39
39 -
 40
40 -
 41
41 -
 42
42 -
 43
43 -
 44
44 -
 45
45 -
 46
46 -
 47
47 -
 48
48 -
 49
49 -
 50
50 -
 51
51 -
 52
52 -
 53
53 -
 54
54 -
55
-
56
-
57
-
58
-
59
-
60
 |
 |

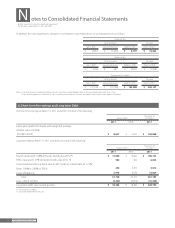
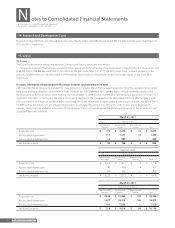
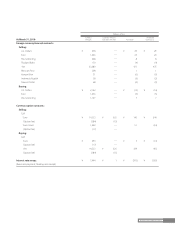
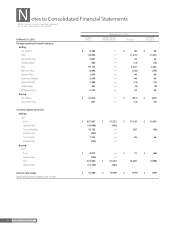
Brother Industries, Ltd. and Consolidated Subsidiaries
For the Years ended March 31, 2011 and 2010
42 Brother Annual Report 2011
Thousands of U.S. Dollars
March 31, 2011 Carrying
amount Fair value
Unrealized
gain
Cash and cash equivalents $ 784,349 $ 784,349 —
Marketable securities 3,614 3,614 —
Receivables 749,217 749,217 —
Investment securities 154,326 154,386 $ 60
Total $ 1,691,506 $ 1,691,566 $ 60
Short-term borrowings $ 104,060 $ 104,060 —
Current portion of long-term debt 41,229 41,337 $ 108
Payables 571,265 571,265 —
Income taxes payable 88,506 88,506 —
Long-term debt 220,554 223,687 3,133
Total $ 1,025,614 $ 1,028,855 $ 3,241
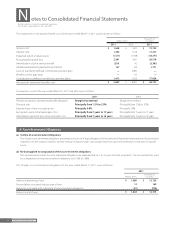
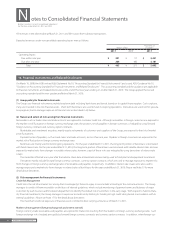
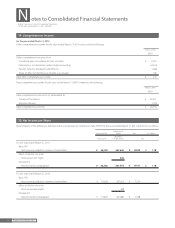
Cash and cash equivalents
The carrying values of cash and cash equivalents approximate fair value because of their short maturities.
Marketable and investment securities
The fair values of marketable and investment securities are measured at the quoted market price of the stock exchange for the equity instruments,
and at the quoted price obtained from the financial institution for certain debt instruments. The information of the fair value for the marketable
and investment securities by classification is included in Note 4.
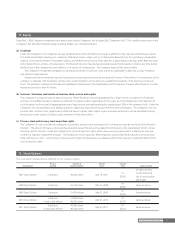
Receivables and payables
For the year ended March 31, 2011, the carrying values of receivables approximate fair value because of their short maturities.
For the year ended March 31, 2010, the fair value of receivables was calculated as the total of the fair value of notes receivable and the fair
value of accounts receivable.
The fair value of notes receivable was measured at the amount to be received at maturity, discounted at the Group’s assumed corporate
discount rate. On the other hand, the fair value of accounts receivable was the book value of accounts receivable minus allowance for doubtful
accounts, since accounts receivable were settled in a short term period and doubtful accounts were estimated based on collectability. The carry-
ing values of payables approximated fair value because of their short maturities.
Short-term borrowings and long- term debt
The carrying values of short-term borrowings approximate fair value because of their short maturities.
The fair value of Company’s bonds is measured at the quoted market price of the bond market. The fair value of bonds of certain subsidiaries
is determined by the cash flows related to the bond at their assumed corporate borrowing rate.
For the year ended March 31, 2011, the fair value of long-term debt is determined by the cash flows related to the debt at the Group’s assumed
borrowing rate.
For the year ended March 31, 2010, the carrying amounts of bank loans approximated the fair value because their interest rates were variable
rates, which reflected the market rate within short term, and also the Group’s credibility had not changed significantly since the borrowing date.
Carrying amounts of lease obligations approximate fair value, because neither the risk free rate nor the Group’s credibility has changed signifi-
cantly since the date of lease inception.
Income taxes payable
The carrying values of income taxes payable approximate fair value because of their short maturities.
Derivatives
The information of the fair value for derivatives is included in Note 17.
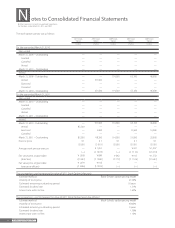
Notes to Consolidated Financial Statements