Brother International 2011 Annual Report Download - page 32
Download and view the complete annual report
Please find page 32 of the 2011 Brother International annual report below. You can navigate through the pages in the report by either clicking on the pages listed below, or by using the keyword search tool below to find specific information within the annual report.-
 1
1 -
2
-
3
-
4
-
5
-
6
-
7
-
8
-
9
-
10
-
11
-
12
-
13
-
14
-
15
-
16
-
17
-
18
-
19
-
20
-
21
-
 22
22 -
 23
23 -
 24
24 -
 25
25 -
 26
26 -
 27
27 -
 28
28 -
 29
29 -
 30
30 -
 31
31 -
 32
32 -
 33
33 -
 34
34 -
 35
35 -
 36
36 -
 37
37 -
 38
38 -
 39
39 -
 40
40 -
 41
41 -
 42
42 -
43
-
44
-
45
-
46
-
47
-
48
-
49
-
50
-
51
-
52
-
53
-
54
-
55
-
56
-
57
-
58
-
59
-
60
 |
 |

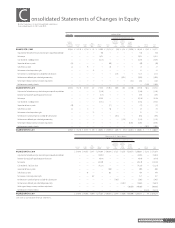
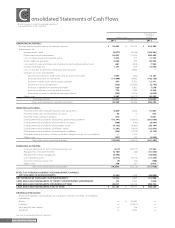
Brother Industries, Ltd. and Consolidated Subsidiaries
For the Years ended March 31, 2011 and 2010
30 Brother Annual Report 2011
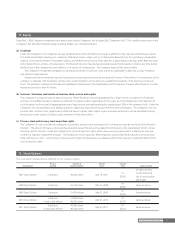
Furthermore, the group pursues the growth of the whole group by strengthening the ability of contents development and entering into a
new business field, using the expanded customer basis.
Outline of the accounting procedures applied
This transaction is recorded as a transaction under common control, based on the ASBJ Statement No.21, “Accounting Standard for Business Com-
binations” (December 26, 2008) and the ASBJ Guidance No.10, “Guidance on Accounting Standard for Business Combinations and Accounting
Standard for Business Divestitures” (December 26, 2008).
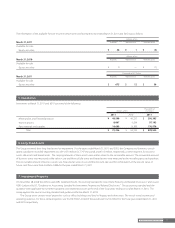
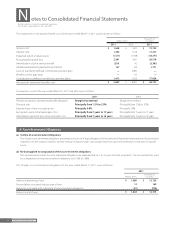
4. Marketable and Investment Securities
Marketable and investment securities as of March 31, 2011 and 2010 consisted of the following:
Millions of Yen
Thousands of
U.S. Dollars
2011 2010 2011
Current:
Government and corporate bonds ¥ 300 ¥ 300 $ 3,614
Total ¥ 300 ¥ 300 $ 3,614
Non-current:
Marketable equity securities ¥ 12,759 ¥ 13,669 $ 153,723
Government and corporate bonds 525 525 6,325
Other 223 237 2,687
Total ¥ 13,507 ¥ 14,431 $ 162,735
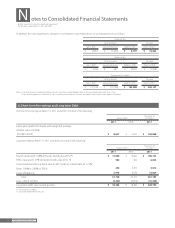
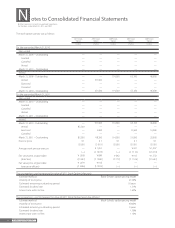
The carrying amounts and aggregate fair values of marketable and investment securities at March 31, 2011 and 2010 were as follows:
March 31, 2011
Millions of Yen
Cost
Unrealized
Gains
Unrealized
Losses
Fair
Value
Securities classi ed as:
Available-for-sale:
Equity securities ¥ 8,568 ¥ 4,289 ¥ (713) ¥ 12,144
Other 139 1 140
Held-to-maturity 825 5 830
March 31, 2010
Millions of Yen
Cost
Unrealized
Gains
Unrealized
Losses
Fair
Value
Securities classi ed as:
Available-for-sale:
Equity securities ¥ 8,015 ¥ 5,033 ¥ (24) ¥ 13,024
Other 139 18 — 157
Held-to-maturity 825 6 — 831
March 31, 2011
Thousands of U.S. Dollars
Cost Unrealized
Gains
Unrealized
Losses
Fair
Value
Securities classi ed as:
Available-for-sale:
Equity securities $ 103,229 $ 51,675 $ (8,591) $ 146,313
Other 1,676 12 — 1,688
Held-to-maturity 9,939 60 — 9,999
Notes to Consolidated Financial Statements