Brother International 2011 Annual Report Download - page 52
Download and view the complete annual report
Please find page 52 of the 2011 Brother International annual report below. You can navigate through the pages in the report by either clicking on the pages listed below, or by using the keyword search tool below to find specific information within the annual report.-
 1
1 -
2
-
3
-
4
-
5
-
6
-
7
-
8
-
9
-
10
-
11
-
12
-
13
-
14
-
15
-
16
-
17
-
18
-
19
-
20
-
21
-
22
-
23
-
24
-
25
-
26
-
27
-
28
-
29
-
30
-
31
-
32
-
33
-
34
-
35
-
36
-
37
-
38
-
39
-
40
-
41
-
 42
42 -
 43
43 -
 44
44 -
 45
45 -
 46
46 -
 47
47 -
 48
48 -
 49
49 -
 50
50 -
 51
51 -
 52
52 -
 53
53 -
 54
54 -
 55
55 -
 56
56 -
 57
57 -
 58
58 -
 59
59 -
 60
60
 |
 |

50 Brother Annual Report 2011
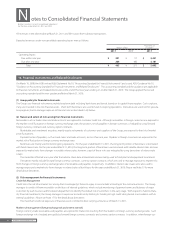
comprehensive strategies of products and services. “Printing & Solutions” consists of sales and production of communication printing device such
as printers and multi-function printers, and of sales and production of electronic stationeries. “Personal & Home” consists of sales and production
of home sewing machines. “Machinery & Solution” consists of sales and production of industrial sewing machines and machine tools. “Network &
Contents” consists of sales and production of online karaoke machine, and of contents distribution services.
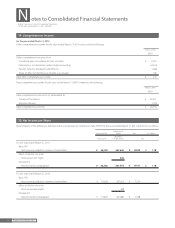
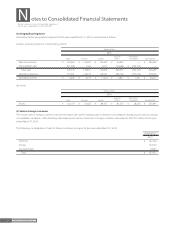
2. Methods of measurement for the amounts of sales, profit (loss), assets, liabilities and other items for each reportable segment
The accounting policies of each reportable segment are consistent to those disclosed in Note 2, “Summary of Significant Accounting Policies.”
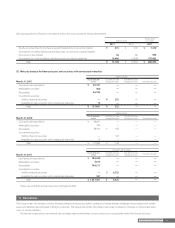
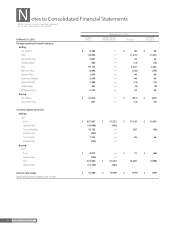
3. Information about sales, profit (loss), assets, liabilities and other items is as follows:
Millions of Yen
2011
Reportable segment
Printing &
Solutions
Personal
& Home
Machinery
& Solution
Network
& Contents Others Total Reconciliation Consolidated
Sales
Sales to external customers ¥340,194 ¥ 29,433 ¥ 66,412 ¥ 52,805 ¥ 13,986 ¥502,830 — ¥502,830
Intersegment sales or transfers — — — — 5,876 5,876 ¥ (5,876) —
Total ¥340,194 ¥ 29,433 ¥ 66,412 ¥ 52,805 ¥ 19,862 ¥508,706 ¥ (5,876) ¥502,830
Segment profit ¥ 27,093 ¥ 2,942 ¥ 7,490 ¥ (2,731) ¥ 1,298 ¥ 36,092 — ¥ 36,092
Segment assets 206,559 17,398 54,104 38,427 63,380 379,868 ¥ (7,222) 372,646
Other:
Depreciation ¥ 15,400 ¥ 626 ¥ 1,371 ¥ 5,735 ¥ 895 ¥ 24,027 — ¥ 24,027
Amortization of goodwill 213 — 20 2,336 — 2,569 — 2,569
Investments in associated
companies 422 93 9,575 — 1,375 11,465 — 11,465
Increase in property, plant and
equipment and intangible assets 11,078 678 951 3,922 390 17,019 ¥ 2,769 19,788
Millions of Yen
2010
Reportable segment
Printing &
Solutions
Personal
& Home
Machinery
& Solution
Network
& Contents Others Total Reconciliation Consolidated
Sales
Sales to external customers ¥ 341,470 ¥ 27,948 ¥ 31,791 ¥ 32,739 ¥ 12,321 ¥ 446,269 — ¥ 446,269
Intersegment sales or transfers — — — — 7,909 7,909 ¥ (7,909) —
Total ¥ 341,470 ¥ 27,948 ¥ 31,791 ¥ 32,739 ¥ 20,230 ¥ 454,178 ¥ (7,909) ¥ 446,269
Segment profit ¥ 26,427 ¥ 1,797 ¥ (2,673) ¥ 573 ¥ 513 ¥ 26,637 — ¥ 26,637
Segment assets 212,095 17,578 47,358 51,636 82,178 410,845 ¥ (44,854) 365,991
Other:
Depreciation ¥ 15,763 ¥ 680 ¥ 1,293 ¥ 2,560 ¥ 732 ¥ 21,028 — ¥ 21,028
Amortization of goodwill 213 — 10 486 — 709 — 709
Investments in associated
companies 386 69 9,266 — 1,285 11,006 — 11,006
Increase in property, plant and
equipment and intangible assets 8,793 531 532 3,180 278 13,314 ¥ 4,168 17,482
Notes to Consolidated Financial Statements
Brother Industries, Ltd. and Consolidated Subsidiaries
For the Years ended March 31, 2011 and 2010