Brother International 2011 Annual Report Download - page 53
Download and view the complete annual report
Please find page 53 of the 2011 Brother International annual report below. You can navigate through the pages in the report by either clicking on the pages listed below, or by using the keyword search tool below to find specific information within the annual report.-
 1
1 -
2
-
3
-
4
-
5
-
6
-
7
-
8
-
9
-
10
-
11
-
12
-
13
-
14
-
15
-
16
-
17
-
18
-
19
-
20
-
21
-
22
-
23
-
24
-
25
-
26
-
27
-
28
-
29
-
30
-
31
-
32
-
33
-
34
-
35
-
36
-
37
-
38
-
39
-
40
-
41
-
42
-
 43
43 -
 44
44 -
 45
45 -
 46
46 -
 47
47 -
 48
48 -
 49
49 -
 50
50 -
 51
51 -
 52
52 -
 53
53 -
 54
54 -
 55
55 -
 56
56 -
 57
57 -
 58
58 -
 59
59 -
 60
60
 |
 |

51
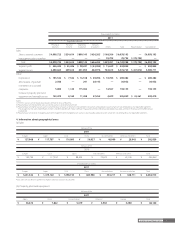
Brother Annual Report 2011
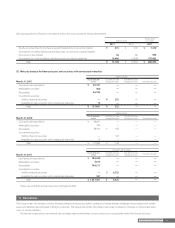
Thousands of U.S. Dollars
2011
Reportable segment
Printing &
Solutions
Personal
& Home
Machinery
& Solution
Network
& Contents Others Total Reconciliation Consolidated
Sales
Sales to external customers
$ 4,098,723 $354,614 $800,145 $636,205 $168,506 $ 6,058,193 — $ 6,058,193
Intersegment sales or transfers
— — — — 70,795 70,795 $ (70,795) —
Total
$ 4,098,723 $354,614 $800,145 $636,205 $239,301 $ 6,128,988 $ (70,795) $ 6,058,193
Segment profit
$ 326,422 $ 35,446 $ 90,241 $ (32,904) $ 15,639 $ 434,844 — $ 434,844
Segment assets
2,488,663 209,614 651,855 462,976 763,615 4,576,723 $ (87,012) 4,489,711
Other:
Depreciation
$ 185,542 $ 7,542 $ 16,518 $ 69,096 $ 10,784 $ 289,482 — $ 289,482
Amortization of goodwill
2,566 — 241 28,145 — 30,952 — 30,952
Investments in associated
companies
5,084 1,120 115,362 — 16,567 138,133 — 138,133
Increase in property, plant and
equipment and intangible assets
133,470 8,169 11,458 47,253 4,699 205,049 $ 33,361 238,410
Notes:
1) “Others” consists of real estate, leasing parts and other areas of business.
2) Reconciliation of intersegment sales or transfers consists of elimination of itself.
3) Reconciliation of segment assets consists of elimination of assets arising from intersegment transactions and corporate assets which are not attributed to any reportable segments.
The amounts for the year ended March 31, 2011 and 2010 are ¥58,372 million ($703,277 thousand) and ¥51,150 million ($616,265 thousand), and ¥87,819 million and ¥42,965 million,
respectively.
4) Reconciliation of increase in property, plant and equipment and intangible assets consists of principally corporate assets which are not attributed to any reportable segments.
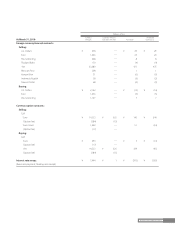
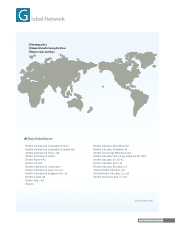
4. Information about geographical areas
(a) Sales
Millions of Yen
2011
Europe Japan U.S.A China Asia and others Americas and others Total
¥ 137,068 ¥ 117,787 ¥ 116,095 ¥ 56,937 ¥ 46,000 ¥ 28,943 ¥ 502,830
Millions of Yen
2010
Europe U.S.A Japan Asia and others Americas and others Total
¥ 144,792 ¥ 117,944 ¥ 88,294 ¥ 70,043 ¥ 25,196 ¥ 446,269
Thousands of U.S. Dollars
2011
Europe Japan U.S.A China Asia and others Americas and others Total
$ 1,651,422 $ 1,419,120 $ 1,398,735 $ 685,988 $ 554,217 $ 348,711 $ 6,058,193
Note: Sales are classified in countries or regions based on location of customers.
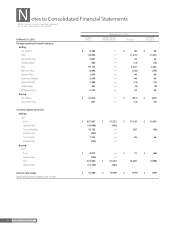
(b) Property, plant and equipment
Millions of Yen
2011
Japan China Asia and others Americas Europe Total
¥ 46,676 ¥ 7,822 ¥ 5,419 ¥ 4,963 ¥ 3,280 ¥ 68,160