Brother International 2011 Annual Report Download - page 23
Download and view the complete annual report
Please find page 23 of the 2011 Brother International annual report below. You can navigate through the pages in the report by either clicking on the pages listed below, or by using the keyword search tool below to find specific information within the annual report.-
 1
1 -
2
-
3
-
4
-
5
-
6
-
7
-
8
-
9
-
10
-
11
-
12
-
 13
13 -
 14
14 -
 15
15 -
 16
16 -
 17
17 -
 18
18 -
 19
19 -
 20
20 -
 21
21 -
 22
22 -
 23
23 -
 24
24 -
 25
25 -
 26
26 -
 27
27 -
 28
28 -
 29
29 -
 30
30 -
 31
31 -
 32
32 -
 33
33 -
34
-
35
-
36
-
37
-
38
-
39
-
40
-
41
-
42
-
43
-
44
-
45
-
46
-
47
-
48
-
49
-
50
-
51
-
52
-
53
-
54
-
55
-
56
-
57
-
58
-
59
-
60
 |
 |

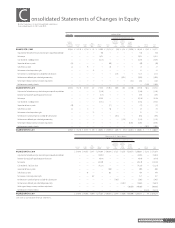
Brother Industries, Ltd. and Consolidated Subsidiaries
Years ended March 31, 2011 and 2010
21
Brother Annual Report 2011
Thousands Millions of Yen
Accumulated other comprehensive income (loss)
Number of
Shares of
Common Stock
Outstanding
Common
Stock
Capital
Surplus
Stock
Acquisition
Rights
Retained
Earnings
Treasury
Stock
Unrealized
Gain (Loss) on
Available-for-
sale
Securities
Deferred
Gain (Loss)
Under
Hedge
Accounting
Foreign
Currency
Translation
Adjustments Total
Minority
Interests
Total
Equity
BALANCE, APRIL 1, 2009 267,649 ¥ 19,210 ¥ 16,134 ¥ 195 ¥ 197,083 ¥ (11,672) ¥ (30) ¥ 3,114 ¥ (27,048) ¥ 196,986 ¥ 2,385 ¥ 199,371
Adjustment of retained earnings due to change in scope of consolidation — — — — 310 — — — — 310 — 310
Net income — — — — 19,629 — — — — 19,629 — 19,629
Cash dividends, ¥ 20.00 per share — — — — (5,375) — — — — (5,375) — (5,375)
Acquisition of treasury stock (39) — — — — (40) — — — (40) — (40)
Sale of treasury stock 24 — 15 — — 10 — — — 25 — 25
Net increase in stock acquisition rights — — — 92 — — — — — 92 — 92
Net increase in unrealized gain on available-for-sale securities — — — — — — 3,128 — — 3,128 — 3,128
Net decrease in deferred gain under hedge accounting — — — — — — — (2,013) — (2,013) — (2,013)
Net change in foreign currency translation adjustments — — — — — — — — (232) (232) — (232)
Net decrease in minority interests — — — — — — — — — — (1,363) (1,363)
BALANCE, MARCH 31, 2010 267,634 19,210 16,149 287 211,647 (11,702) 3,098 1,101 (27,280) 212,510 1,022 213,532
Adjustment of retained earnings due to change in scope of consolidation — — — — (1,246) — — — — (1,246) — (1,246)
Decrease due to split-off type of corporate divestiture — — — — (375) — — — — (375) — (375)
Net income — — — — 26,238 — — — — 26,238 — 26,238
Cash dividends, ¥ 22.00 per share — — — — (5,912) — — — — (5,912) — (5,912)
Acquisition of treasury stock (20) — — — — (17) — — — (17) — (17)
Sale of treasury stock 34 — 8 — — 30 — — — 38 — 38
Net increase in stock acquisition rights — — — 52 — — — — — 52 — 52
Net decrease in unrealized gain on available-for-sale securities — — — — — — (653) — — (653) — (653)
Net decrease in deferred gain under hedge accounting — — — — — — — (1,192) — (1,192) — (1,192)
Net change in foreign currency translation adjustments — — — — — — — — (8,981) (8,981) — (8,981)
Net decrease in minority interests — — — — — — — — — — (1,015) (1,015)
BALANCE, MARCH 31, 2011 267,648 ¥ 19,210 ¥ 16,157 ¥ 339 ¥ 230,352 ¥ (11,689) ¥ 2,445 ¥ (91) ¥ (36,261) ¥ 220,462 ¥ 7 ¥ 220,469
Thousands of U.S. Dollars (Note 1)
Accumulated other comprehensive income (loss)
Common
Stock
Capital
Surplus
Stock
Acquisition
Rights
Retained
Earnings
Treasury
Stock
Unrealized
Gain (Loss) on
Available-for-
sale
Securities
Deferred
Gain (Loss)
Under
Hedge
Accounting
Foreign
Currency
Translation
Adjustments Total
Minority
Interests
Total
Equity
BALANCE, MARCH 31, 2010 $ 231,446 $ 194,567 $ 3,457 $ 2,549,964 $ (140,988) $ 37,325 $ 13,265 $ (328,675) $ 2,560,361 $ 12,313 $ 2,572,674
Adjustment of retained earnings due to change in scope of consolidation — — — (15,012) — — — — (15,012) — (15,012)
Decrease due to split-off type of corporate divestiture — — — (4,518) — — — — (4,518) — (4,518)
Net income — — — 316,120 — — — — 316,120 — 316,120
Cash dividends, $ 0.27 per share — — — (71,229) — — — — (71,229) — (71,229)
Acquisition of treasury stock — — — — (205) — — — (205) — (205)
Sale of treasury stock — 96 — — 362 — — — 458 — 458
Net increase in stock acquisition rights — — 627 — — — — — 627 — 627
Net decrease in unrealized gain on available-for-sale securities — — — — — (7,867) — — (7,867) — (7,867)
Net decrease in deferred gain under hedge accounting — — — — — — (14,361) — (14,361) — (14,361)
Net change in foreign currency translation adjustments ——— — ——
— (108,205) (108,205) — (108,205)
Net decrease in minority interests ——— — ——
——— (12,229) (12,229)
BALANCE, MARCH 31, 2011 $ 231,446 $ 194,663 $ 4,084 $ 2,775,325 $ (140,831) $ 29,458 $ (1,096) $ (436,880) $ 2,656,169 $ 84 $ 2,656,253
See notes to consolidated financial statements.
Consolidated Statements of Changes in Equity