Brother International 2009 Annual Report Download - page 43
Download and view the complete annual report
Please find page 43 of the 2009 Brother International annual report below. You can navigate through the pages in the report by either clicking on the pages listed below, or by using the keyword search tool below to find specific information within the annual report.-
 1
1 -
2
-
3
-
4
-
5
-
6
-
7
-
8
-
9
-
10
-
11
-
12
-
13
-
14
-
15
-
16
-
17
-
18
-
19
-
20
-
21
-
22
-
23
-
24
-
25
-
26
-
27
-
28
-
29
-
30
-
31
-
32
-
 33
33 -
 34
34 -
 35
35 -
 36
36 -
 37
37 -
 38
38 -
 39
39 -
 40
40 -
 41
41 -
 42
42 -
 43
43 -
 44
44 -
 45
45 -
 46
46 -
 47
47 -
 48
48
 |
 |

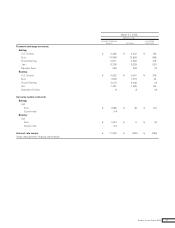
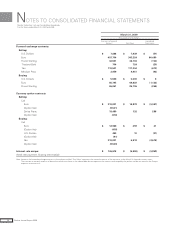
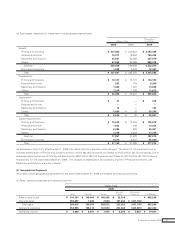
(b) Total assets, depreciation, impairment loss and capital expenditures:
Millions of Yen
Thousands of
U.S. Dollars
2009 2008 2009
Assets:
Printing and Solutions ¥ 214,862 ¥ 230,912 $ 2,192,469
Personal and Home 18,071 18,604 184,398
Machinery and Solution 35,967 44,068 367,010
Others 67,559 96,099 689,378
Subtotal 336,459 389,683 3,433,255
Elimination/Corporate 1,208 2,576 12,327
Total ¥ 337,667 ¥ 392,259 $ 3,445,582
Depreciation:
Printing and Solutions ¥ 14,127 ¥ 13,177 $ 144,153
Personal and Home 881 734 8,990
Machinery and Solution 1,068 1,027 10,898
Others 7,018 7,289 71,612
Total ¥ 23,094 ¥ 22,227 $ 235,653
Impairment:
Printing and Solutions ¥41 —$ 418
Personal and Home —— —
Machinery and Solution 14 —143
Others 2,480 ¥28 25,306
Total ¥ 2,535 ¥28
$ 25,867
Capital expenditures:
Printing and Solutions ¥ 12,630 ¥ 14,258 $ 128,878
Personal and Home 1,003 808 10,235
Machinery and Solution 2,485 438 25,357
Others 1,739 6,429 17,745
Subtotal 17,857 21,933 182,215
Elimination/Corporate 9,312 9,672 95,020
Total ¥ 27,169 ¥ 31,605 $ 277,235
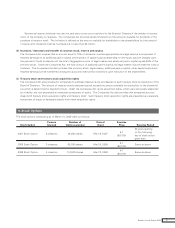
As discussed in Note 2(7), effective April 1, 2008, the useful lives for machinery were changed. The effect of this treatment was to
increase depreciation of Printing and Solutions by ¥312 million ($3,184 thousand) and Others by ¥115 million ($1,173 thousand), and to
decrease operating income of Printing and Solutions by ¥308 million ($3,143 thousand) and Others by ¥113 million ($1,153 thousand),
respectively, for the year ended March 31, 2009. The impacts on depreciation and operating income of Personal and Home, and
Machinery and Solution were not material.
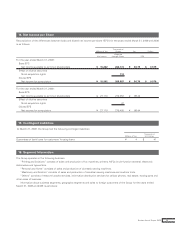
(2) Geographical Segments
Information about geographical segments for the years ended March 31, 2009 and 2008 is summarized as follows:
(a) Sales, operating expenses and operating income:
Millions of Yen
2009
Japan Americas Europe
Asia and
Others
Eliminations
/Corporate Consolidated
Sales to customers ¥ 105,191 ¥ 158,900 ¥ 166,008 ¥ 52,106 —¥ 482,205
Interarea sales 255,487 1,463 3,504 181,246 ¥ (441,700) —
Total sales 360,678 160,363 169,512 233,352 (441,700) 482,205
Operating expenses 356,980 158,312 161,553 231,046 (445,587) 462,304
Operating income ¥ 3,698 ¥ 2,051 ¥ 7,959 ¥ 2,306 ¥ 3,887 ¥ 19,901
41Brother Annual Report 2009