Brother International 2009 Annual Report Download - page 3
Download and view the complete annual report
Please find page 3 of the 2009 Brother International annual report below. You can navigate through the pages in the report by either clicking on the pages listed below, or by using the keyword search tool below to find specific information within the annual report.-
 1
1 -
 2
2 -
 3
3 -
 4
4 -
 5
5 -
 6
6 -
 7
7 -
 8
8 -
 9
9 -
 10
10 -
 11
11 -
 12
12 -
 13
13 -
 14
14 -
15
-
16
-
17
-
18
-
19
-
20
-
21
-
22
-
23
-
24
-
25
-
26
-
27
-
28
-
29
-
30
-
31
-
32
-
33
-
34
-
35
-
36
-
37
-
38
-
39
-
40
-
41
-
42
-
43
-
44
-
45
-
46
-
47
-
48
 |
 |

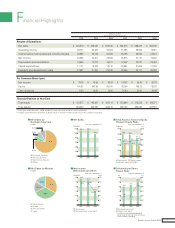
Financial Highlights
Millions of Yen
Fiscal years ended March 31
2004 2005 2006* 2007 2008 2009
Results of Operations:
Net sales ¥ 424,919 ¥ 438,540 ¥ 579,180 ¥ 562,273 ¥ 566,379 ¥ 482,205
Operating income 39,721 33,447 45,004 51,255 53,503 19,901
Income before income taxes and minority interests 33,863 29,724 42,328 45,788 46,282 23,613
Net income 20,485 20,401 24,644 28,875 27,110 15,262
Depreciation and amortization 13,803 14,212 16,811 18,442 22,227 23,094
Capital expenditures 17,121 18,878 18,710 28,962 31,605 27,169
Research and development costs 21,397 21,991 25,248 28,454 34,117 36,859
Per Common Share (yen):
Net income ¥ 73.76 ¥ 73.55 ¥ 89.03 ¥ 104.82 ¥ 98.46 ¥ 56.79
Equity 476.32 542.56 657.05 763.94 785.13 735.26
Cash dividends 8.50 10.00 13.00 20.00 22.00 26.00**
Financial Position at Year-End:
Total equity ¥ 131,677 ¥ 149,921 ¥ 181,114 ¥ 213,664 ¥ 219,223 ¥ 199,371
Total assets 323,090 343,896 348,218 399,109 392,259 337,667
*Fiscal year ended March 31, 2006 includes 3-month transition period of some subsidiaries.
**Includes commemorative dividends of ¥2 per share to mark the 100th anniversary of the Company’s founding.
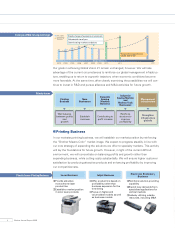
Net Sales by
Business Segment
72.8%
6.4%
8.1%
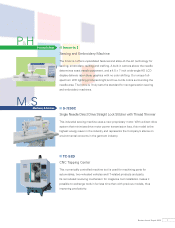
Printing & Solutions
Personal & Home
Machinery & Solution
Others
8.6%
76.9%
(FY2008)
Net Sales by Market
The Americas
Europe
Asia and Others
Japan
16.9%
33.2%
34.8%
15.1%
(FY2008)
Net Sales
(¥ billion)
0
100
200
300
400
500
600
200920082007
562.3 566.4
482.2
Fiscal years ended March 31
Total assets Owner’s equity
Total Assets & Owner’s Equit
y
Owners’ Equity Ratio
(¥ billion)
200920082007
(%)
0
100
200
300
400
500
0
20
40
60
80
100
399.1 392.3
337.7
210.4
52.7 55.1 58.3
216.3 197.0
Fiscal years ended March 31
Owners’ equity ratio (right)
Net income
Net Income
Net Income per Share
(¥ billion)
0
5
10
15
20
25
30
200920082007
20
40
60
80
100
120
0
(yen)
Net income per share (right)
28.9
104.8 98.5
56.8
27.1
15.3
Fiscal years ended March 31
Dividends per share
Dividends per Share
Payout Ratio
(¥)
0
5
10
15
20
25
30
2009*20082007
0
Payout ratio (right)
* Includes commemorative dividends of
¥2 per share to mark the 100th anniversary
of the Company’s founding.
10
20
30
40
50
60
20.0
19.1
22.3
45.8
22.0
26.0
(%)
Fiscal years ended March 31
1Brother Annual Report 2009