Brother International 2009 Annual Report Download - page 13
Download and view the complete annual report
Please find page 13 of the 2009 Brother International annual report below. You can navigate through the pages in the report by either clicking on the pages listed below, or by using the keyword search tool below to find specific information within the annual report.-
 1
1 -
2
-
 3
3 -
 4
4 -
 5
5 -
 6
6 -
 7
7 -
 8
8 -
 9
9 -
 10
10 -
 11
11 -
 12
12 -
 13
13 -
 14
14 -
 15
15 -
 16
16 -
 17
17 -
 18
18 -
 19
19 -
 20
20 -
 21
21 -
 22
22 -
 23
23 -
24
-
25
-
26
-
27
-
28
-
29
-
30
-
31
-
32
-
33
-
34
-
35
-
36
-
37
-
38
-
39
-
40
-
41
-
42
-
43
-
44
-
45
-
46
-
47
-
48
 |
 |

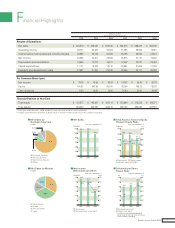
Management’s Discussion and Analysis
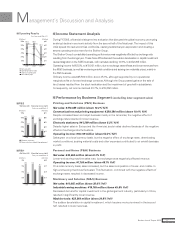
Income Statement Analysis
During FY2008, a financial crisis grew into a situation that disrupted the global economy, prompting
an abrupt decline in economic activity from the second half of the fiscal year. The impact of this
crisis spread into real economies worldwide, causing substantial yen appreciation and creating a
severe operating environment for the Brother Group.
The Brother Group’s consolidated operating performance was negatively affected by exchange rate
resulting from the stronger yen. These forex difficulties and the sudden deceleration in capital investment
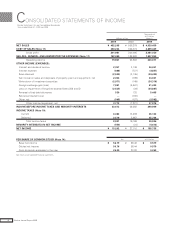
caused stagnation in the M&S business, with net sales declining 14.9%, to ¥482,205 million.
Operating income fell 62.8%, to ¥19,901 million, due to exchange rates effects and lower revenues from
the M&S business, as well as worsening market conditions and soaring raw materials prices, mainly in
the P&S business.
Ordinary income was ¥25,562 million, down 45.1%, although supported by non-operational
marginal profits on forward exchange contracts. Although the Group posted gains on the sale of
land, losses resulted from the stock revaluation and the impairment of goodwill in subsidiaries.
Consequently, net income declined 43.7%, to ¥15,262 million.
Performance by Business Segment (excluding inter-segment sales)
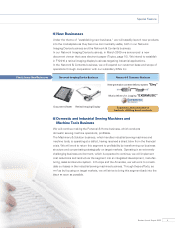
Printing and Solutions (P&S) Business
Net sales: ¥370,685 million (down 10.2% YoY)
Communications and printing equipment: ¥329,386 million (down 10.4% YoY)
Despite increased laser and inkjet business mainly in the Americas, the negative effect of
exchange rates resulted in lower revenue.
Electronic stationery: ¥41,299 million (down 8.2% YoY)
Despite higher sales in Europe and the Americas, sector sales declined because of the negative
effects of exchange rate fluctuations.
Operating income: ¥18,149 million (down 53.2% YoY)
Sales grew on a local currency basis, but the negative effect of exchange rates, deteriorating
market conditions, soaring material costs and other expenses contributed to an overall decrease
in profit.
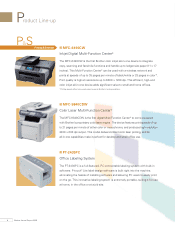
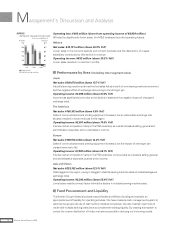
Personal and Home (P&H) Business
Net sales: ¥30,664 million (down 9.3% YoY)
Lower-end sewing machine sales rose, but exchange rates negatively affected revenue.
Operating income: ¥1,765 million (down 48.1% YoY)
On a local currency basis, sales increased, but the sales composition of lower- and middle- to
high-end sewing machines fluctuated. This fluctuation, combined with the negative effects of
exchange rates, resulted in decreased income.
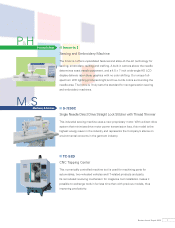
Machinery and Solution (M&S) Business
Net sales: ¥41,665 million (down 38.6% YoY)
Industrial sewing machines: ¥19,105 million (down 45.8% YoY)
Decreased demand for capital investment in the global garment industry, particularly in China,
resulted in significantly lower revenue.
Machine tools: ¥22,560 million (down 30.8% YoY)
The sudden deceleration in capital investment, which became more prominent in the second
half, resulted in lower revenues.
Net sales (left)
Operating income (right)
Ordinary income (right)
Net income (right)
Operating Results
(¥ billion) (¥ billion)
562.3 566.4
482.2
0
100
200
300
400
500
600
200920082007 0
10
20
30
40
50
60
51.3 53.5
19.9
45.5 46.5
25.6
28.9 27.1
15.3
Fiscal years ended March 31
Electronic stationery
Communications and printing equipment
P&S
Net Sales & Operating Income
(¥ billion) (¥ billion)
397.6 412.6
370.7
Fiscal years ended March 31
37.4 38.8
18.1
•
Net Sales (left)
•
Operating Income (right)
0
100
200
300
400
500
200920082007 0
15
30
45
60
75
P&H
(¥ billion) (¥ billion)
34.2 33.8
30.7
2.5
3.4
1.8
Fiscal years ended March 31
•
Net Sales (left)
•
Operating Income (right)
0
10
20
30
40
200920082007 0
1.5
3.0
4.5
6.0
11Brother Annual Report 2009