Abercrombie & Fitch 2003 Annual Report Download - page 26
Download and view the complete annual report
Please find page 26 of the 2003 Abercrombie & Fitch annual report below. You can navigate through the pages in the report by either clicking on the pages listed below, or by using the keyword search tool below to find specific information within the annual report.-
 1
1 -
2
-
3
-
4
-
5
-
6
-
7
-
8
-
9
-
10
-
11
-
12
-
13
-
14
-
15
-
 16
16 -
 17
17 -
 18
18 -
 19
19 -
 20
20 -
 21
21 -
 22
22 -
 23
23 -
 24
24 -
 25
25 -
 26
26 -
 27
27 -
 28
28 -
 29
29 -
 30
30 -
 31
31 -
 32
32 -
 33
33 -
 34
34 -
 35
35 -
 36
36 -
37
-
38
-
39
-
40
-
41
-
42
 |
 |

Abercrombie &Fitch
24
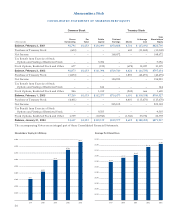
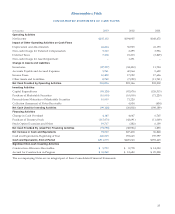
CONSOLIDATED STATEMENTS OF SH AREHOLDERS’ EQUITY
Common Stock Treasury Stock
Total
Shares Par Paid-In Retained At Average Shareholders’
(Thousands)Outstanding Value Capital Earnings Shares Cost Equity
Balance, February 3, 2001 98,796 $1,033 $136,490 $350,868 4,504 $ (65,691) $422,700
Purchase of Treasury Stock (600) – – – 600 (11,069) (11,069)
Net Income – – – 168,672 – – 168,672
Tax Benefit from Exercise of Stock
Options and Vesting of Restricted Stock – – 5,056 – – – 5,056
Stock Options, Restricted Stock and Other 677 – (152) – (678) 10,227 10,075
Balance, February 2, 2002 98,873 $1,033 $141,394 $519,540 4,426 $ (66,533) $595,434
Purchase of Treasury Stock (1,850) – – – 1,850 (42,691) (42,691)
Net Income – – – 194,935 – – 194,935
Tax Benefit from Exercise of Stock
Options and Vesting of Restricted Stock – – 164 – – – 164
Stock Options, Restricted Stock and Other 246 – 1,019 – (245) 666 1,685
Balance, February 1, 2003 97,269 $1,033 $142,577 $714,475 6,031 $(108,558) $749,527
Purchase of Treasury Stock (4,401) – – – 4,401 (115,670) (115,670)
Net Income – – – 205,102 – – 205,102
Tax Benefit from Exercise of Stock
Options and Vesting of Restricted Stock – – 9,505 – – – 9,505
Stock Options, Restricted Stock and Other 1,739 – (12,943) – (1,740) 35,736 22,793
Balance, January 31, 2004 94,607 $1,033 $139,139 $919,577 8,692 $(188,492) $871,257
The accompanying Notes are an integral part of these Consolidated Financial Statements.
Shareholders’ Equity ($ in Millions)
1999 2000 2001 2002 2003
$423
$100
$200
$300
$400
$500
$600
$700
$800
$900
$311
$750
Earnings Per Diluted Share
1999 2000 2001 2002 2003
$0.20
$0.40
$0.60
$0.80
$1.00
$1.20
$1.40
$1.60
$1.80
$2.00
$2.20
$1.39
$1.55
$1.65
$1.94
$2.06
$871
$595