Abercrombie & Fitch 2003 Annual Report Download - page 13
Download and view the complete annual report
Please find page 13 of the 2003 Abercrombie & Fitch annual report below. You can navigate through the pages in the report by either clicking on the pages listed below, or by using the keyword search tool below to find specific information within the annual report.-
 1
1 -
2
-
 3
3 -
 4
4 -
 5
5 -
 6
6 -
 7
7 -
 8
8 -
 9
9 -
 10
10 -
 11
11 -
 12
12 -
 13
13 -
 14
14 -
 15
15 -
 16
16 -
 17
17 -
 18
18 -
 19
19 -
 20
20 -
 21
21 -
 22
22 -
 23
23 -
24
-
25
-
26
-
27
-
28
-
29
-
30
-
31
-
32
-
33
-
34
-
35
-
36
-
37
-
38
-
39
-
40
-
41
-
42
 |
 |

Abercrombie &Fitch
11
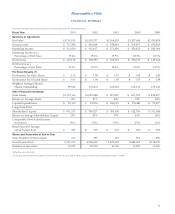
FINANCIAL SUMMARY
(Thousands except per share and per square foot amounts, ratios and store and associate data)
Fiscal Year 2003 2002 2001 2000* 1999
Summary of Operations
Net Sales $1,707,810 $1,595,757 $1,364,853 $1,237,604 $1,030,858
Gross Income $ 717,398 $ 656,049 $ 558,034 $ 509,375 $ 450,383
Operating Income $ 331,634 $ 312,617 $ 271,458 $ 253,652 $ 242,064
Operating Income as a
Percentage of Net Sales 19.4% 19.6% 19.9% 20.5% 23.5%
Net Income $ 205,102 $ 194,935 $ 168,672 $ 158,133 $ 149,604
Net Income as a
Percentage of Net Sales 12.0% 12.2% 12.4% 12.8% 14.5%
Per Share Results (1)
Net Income Per Basic Share $ 2.12 $000 1.99 $000 1.70 $00 0 1.58 $00 0 1.45
Net Income Per Diluted Share $ 2.06 $0000 1.94 $00 0 1.65 $00 01.55 $00 0 1.39
Weighted Average Diluted
Shares Outstanding 99,580 100,631$102,5240102,156 107,641
Other Financial Information
Total Assets $1,199,163 $1,023,048 $ 795,527 $ 607,793 $ 476,317
Return on Average Assets 18% 21% 24% 29% 38%
Capital Expenditures $ 99,128 $092,976 $0126,515 $ 0153,481 $ 73,377
Long-Term Debt ––– ––
Shareholders’ Equity $ 871,257 $ 749,527 $ 595,434 $ 422,700 $ 311,094
Return on Average Shareholders’ Equity 25% 29% 33% 43% 60%
Comparable Store Sales Increase
(Decrease) (9%) (5%) (9%) (7%) 10%
Retail Sales Per Average
Gross Square Foot $ 345 $ 00 0379 $000 , 401 $ 474 $ 505
Stores and Associates at End of Year
Total Number of Stores Open 700 597 491 354 250
Gross Square Feet 5,021,000 4,358,000 3,673,000 2,849,000 2,174,000
Number of Associates 30,200 22,000 16,700 13,900 11,300
*Fifty-three week fiscal year.
(1) Per share amounts have been restated to reflect the two-for-one stock split on A&F’s Class A Common Stock, distributed on June 15, 1999.