Abercrombie & Fitch 2003 Annual Report Download - page 14
Download and view the complete annual report
Please find page 14 of the 2003 Abercrombie & Fitch annual report below. You can navigate through the pages in the report by either clicking on the pages listed below, or by using the keyword search tool below to find specific information within the annual report.-
 1
1 -
2
-
3
-
 4
4 -
 5
5 -
 6
6 -
 7
7 -
 8
8 -
 9
9 -
 10
10 -
 11
11 -
 12
12 -
 13
13 -
 14
14 -
 15
15 -
 16
16 -
 17
17 -
 18
18 -
 19
19 -
 20
20 -
 21
21 -
 22
22 -
 23
23 -
 24
24 -
25
-
26
-
27
-
28
-
29
-
30
-
31
-
32
-
33
-
34
-
35
-
36
-
37
-
38
-
39
-
40
-
41
-
42
 |
 |

Abercrombie &Fitch
RESULTS OF OPERATIONS Net sales for the fourth quarter of the
2003 fiscal year were $560.4 million, an increase of 5% from $534.5
million for the fourth quarter of the 2002 fiscal year. Operating
income for the fourth quarter fiscal 2003 was $154.3 million compared
to $149.6 million in the 2002 fiscal year. Net income increased to $94.3
million in the fourth quarter of the 2003 fiscal year as compared to
$92.8 million in the 2002 fiscal year. Net income per diluted share for
the fourth quarter of the 2003 fiscal year was $.96, up 3% from $.93
in the 2002 fiscal year.
Net sales for the 2003 fiscal year were $1.7 billion, an increase
of 7% over the 2002 fiscal year net sales of $1.6 billion. Operating
income for the 2003 fiscal year increased 6% to $331.6 million from
$312.6 million for the 2002 fiscal year. Net income per diluted share
was $2.06 for the 2003 fiscal year compared to $1.94 in the 2002 fiscal
year, an increase of 6%.
During the 2003 fiscal year, the Company continued its growth
strategy by opening 19 Abercrombie & Fitch stores, 9 abercrombie
stores and 79 Hollister stores, for a total of 107 stores. Sales produc-
tivity of these new store openings continues to be high. During the
fourth quarter of the 2003 fiscal year, the new stores in all three con-
cepts opened during the past 12 months averaged approximately
the same sales per square foot as the existing store base.
The following data represent the Company’s consolidated
statements of income for the last three fiscal years, expressed as a
percentage of net sales:
2003 2002 2001
Net Sales 100.0% 100.0% 100.0%
Cost of Goods Sold, Occupancy
and Buying Costs 58.0 58.9 59.1
Gross Income 42.0 41.1 40.9
General, Administrative
and Store Operating Expenses 22.6 21.5 21.0
Operating Income 19.4 19.6 19.9
Interest Income, Net (0.2) (0.2) (0.4)
Income Before Income Taxes 19.6 19.8 20.3
Provision for Income Taxes 7.6 7.6 7.9
Net Income 12.0 12.2 12.4
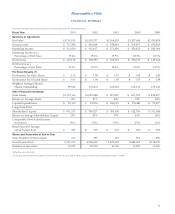
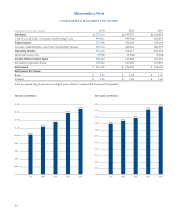
FINANCIAL SUMMARY The following summarized financial data
compares the 2003 fiscal year to the comparable periods for 2002
and 2001: % Change
2002- 2001-
2003 2002 2001 2003 2002
Net sales (millions) $1,708 $1,596 $1,365 7% 17%
Decrease in comparable
store sales (9%) (5%) (9%)
Retail sales increase attributable
to new and remodeled stores,
magazine, catalogue and Web sites 16% 22% 19%
Retail sales per average
gross square foot $0,345 $0,379 $0,401 (9%) (5%)
Retail sales per average store
(thousands) $2,494 $2,797 $3,095 (11%) (10%)
Average store size at year-end
(gross square feet) 7,173 7,300 7,480 (2%) (2%)
Gross square feet at year-end
(thousands) 5,021 4,358 3,673 15% 19%
Number of stores and
gross square feet by concept:
Abercrombie & Fitch:
Stores at beginning of period 340 309 265
Opened 19 33 45
Closed (2))(2) (1)
Stores at end of period 357 340 309
Gross square feet (thousands) 3,154 3,036 2,798
abercrombie:
Stores at beginning of period 164 148 84
Opened 9 19 64
Closed (2) )(3) –
Stores at end of period 171 164 148
Gross square feet (thousands) 753 727 662
Hollister:
Stores at beginning of period 93 34 5
Opened 79 60 29
Closed –)(1) –
Stores at end of period 172 93 34
Gross square feet (thousands) 1,114 595 213
NET SALES: F OURTH QUARTER 2003 Net sales for the fourth
quarter of the 2003 fiscal year were $560.4 million, up 5% over last
year's fourth quarter net sales of $534.5 million. Comparable store
sales, defined as sales in stores that have been open for at least one
year, decreased 11% for the quarter.
By merchandise concept, comparable store sales (“comps”)
for the quarter were as follows: Abercrombie & Fitch’s comps
declined 14% with mens comps declining in the low twenties and
womens declining by a high-single digit percentage. In abercrombie,
the kids’ business, comps decreased 7% with girls achieving a low-
single digit positive comp increase and boys comps declining in the
low twenties. In Hollister, comps were flat when compared to last
year for the quarter. Hollister girls comps were a positive low-single
12
MANAGEMENT’S DISCUSSION AND ANALYSIS