AT&T Uverse 2007 Annual Report Download - page 66
Download and view the complete annual report
Please find page 66 of the 2007 AT&T Uverse annual report below. You can navigate through the pages in the report by either clicking on the pages listed below, or by using the keyword search tool below to find specific information within the annual report.-
 1
1 -
2
-
3
-
4
-
5
-
6
-
7
-
8
-
9
-
10
-
11
-
12
-
13
-
14
-
15
-
16
-
17
-
18
-
19
-
20
-
21
-
22
-
23
-
24
-
25
-
26
-
27
-
28
-
29
-
30
-
31
-
32
-
33
-
34
-
35
-
36
-
37
-
38
-
39
-
40
-
41
-
42
-
43
-
44
-
45
-
46
-
47
-
48
-
49
-
50
-
51
-
52
-
53
-
54
-
55
-
 56
56 -
 57
57 -
 58
58 -
 59
59 -
 60
60 -
 61
61 -
 62
62 -
 63
63 -
 64
64 -
 65
65 -
 66
66 -
 67
67 -
 68
68 -
 69
69 -
 70
70 -
 71
71 -
 72
72 -
 73
73 -
 74
74 -
 75
75 -
 76
76 -
77
-
78
-
79
-
80
-
81
-
82
-
83
-
84
-
85
-
86
-
87
-
88
 |
 |

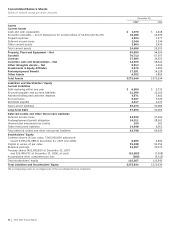
Notes to Consolidated Financial Statements (continued)
Dollars in millions except per share amounts
64
| 2007 AT&T Annual Report
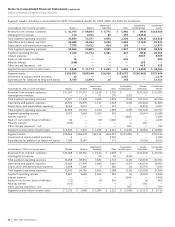
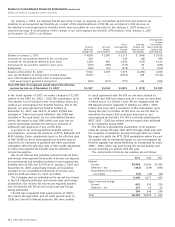
Segment results, including a reconciliation to AT&T consolidated results, for 2007, 2006 and 2005 are as follows:
Advertising & Consolidation Consolidated
At December 31, 2007 or for the year ended Wireless Wireline Publishing Other and Elimination Results
Revenues from external customers $ 42,574 $ 69,565 $ 5,771 $ 1,982 $ (964) $118,928
Intersegment revenues 110 2,012 80 252 (2,454) —
Total segment operating revenues 42,684 71,577 5,851 2,234 (3,418) 118,928
Operations and support expenses 28,585 46,394 3,066 1,664 (2,762) 76,947
Depreciation and amortization expenses 7,079 13,411 924 163 — 21,577
Total segment operating expenses 35,664 59,805 3,990 1,827 (2,762) 98,524
Segment operating income 7,020 11,772 1,861 407 (656) 20,404
Interest expense — — — — 3,507 3,507
Equity in net income of affiliates 16 — — 676 — 692
Minority interest (198) — — — 198 —
Other income (expense) – net — — — — 615 615
Segment income before income taxes $ 6,838 $ 11,772 $ 1,861 $ 1,083 $ (3,350) $ 18,204
Segment assets $105,953 $168,048 $14,910 $183,075 $(196,342) $275,644
Investment in equity method investees 13 — — 2,257 — 2,270
Expenditures for additions to long-lived assets 3,745 13,693 25 254 — 17,717
Advertising & Consolidation Wireless Consolidated
At December 31, 2006 or for the year ended Wireless Wireline Publishing Other and Elimination Elimination Results
Revenues from external customers $37,537 $ 57,473 $ 3,634 $ 1,702 $ — $(37,291) $ 63,055
Intersegment revenues — 5 51 176 (232) — —
Total segment operating revenues 37,537 57,478 3,685 1,878 (232) (37,291) 63,055
Operations and support expenses 26,503 39,878 1,737 1,318 (233) (26,343) 42,860
Depreciation and amortization expenses 6,462 9,676 3 167 — (6,401) 9,907
Total segment operating expenses 32,965 49,554 1,740 1,485 (233) (32,744) 52,767
Segment operating income 4,572 7,924 1,945 393 1 (4,547) 10,288
Interest expense — — — — 1,843 — 1,843
Equity in net income (loss) of affiliates 40 — (17) 2,020 — — 2,043
Minority interest (169) — — — 4 165 —
Other income (expense) – net — — — — 393 — 393
Segment income before income taxes $ 4,443 $ 7,924 $ 1,928 $ 2,413 $ (1,445) $ (4,382) $ 10,881
Segment assets $98,563 $166,178 $14,791 $166,187 $(175,085) $ — $270,634
Investment in equity method investees 3 — — 1,992 — — 1,995
Expenditures for additions to long-lived assets 7,039 8,147 2 171 — (7,039) 8,320
Advertising & Consolidation Wireless Consolidated
At December 31, 2005 or for the year ended Wireless Wireline Publishing Other and Elimination Elimination Results
Revenues from external customers $34,468 $ 38,454 $ 3,625 $ 1,650 $ — $(34,433) $ 43,764
Intersegment revenues — — 59 81 (140) — —
Total segment operating revenues 34,468 38,454 3,684 1,731 (140) (34,433) 43,764
Operations and support expenses 26,033 27,339 1,685 1,066 (137) (26,033) 29,953
Depreciation and amortization expenses 6,608 7,426 5 182 (2) (6,576) 7,643
Total segment operating expenses 32,641 34,765 1,690 1,248 (139) (32,609) 37,596
Segment operating income 1,827 3,689 1,994 483 (1) (1,824) 6,168
Interest expense — — — — 1,456 — 1,456
Equity in net income (loss) of affiliates (11) — (5) 629 — (4) 609
Minority interest (103) — — — 2 101 —
Other income (expense) – net — — — — 397 — 397
Segment income before income taxes $ 1,713 $ 3,689 $ 1,989 $ 1,112 $ (1,058) $ (1,727) $ 5,718