AT&T Uverse 2007 Annual Report Download - page 65
Download and view the complete annual report
Please find page 65 of the 2007 AT&T Uverse annual report below. You can navigate through the pages in the report by either clicking on the pages listed below, or by using the keyword search tool below to find specific information within the annual report.-
 1
1 -
2
-
3
-
4
-
5
-
6
-
7
-
8
-
9
-
10
-
11
-
12
-
13
-
14
-
15
-
16
-
17
-
18
-
19
-
20
-
21
-
22
-
23
-
24
-
25
-
26
-
27
-
28
-
29
-
30
-
31
-
32
-
33
-
34
-
35
-
36
-
37
-
38
-
39
-
40
-
41
-
42
-
43
-
44
-
45
-
46
-
47
-
48
-
49
-
50
-
51
-
52
-
53
-
54
-
 55
55 -
 56
56 -
 57
57 -
 58
58 -
 59
59 -
 60
60 -
 61
61 -
 62
62 -
 63
63 -
 64
64 -
 65
65 -
 66
66 -
 67
67 -
 68
68 -
 69
69 -
 70
70 -
 71
71 -
 72
72 -
 73
73 -
 74
74 -
 75
75 -
76
-
77
-
78
-
79
-
80
-
81
-
82
-
83
-
84
-
85
-
86
-
87
-
88
 |
 |

2007 AT&T Annual Report
| 63
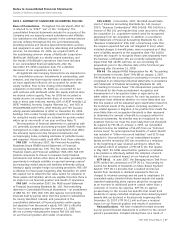
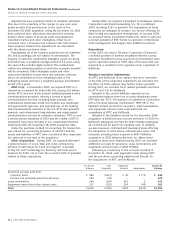
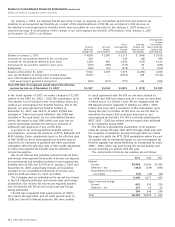
NOTE 3. EARNINGS PER SHARE
A reconciliation of the numerators and denominators of basic
earnings per share and diluted earnings per share for the
years ended December 31, 2007, 2006 and 2005 are shown
in the table below:
Year Ended December 31, 2007 2006 2005
Numerators
Numerator for basic earnings
per share:
Net Income $11,951 $7,356 $4,786
Dilutive potential common shares:
Other stock-based compensation 8 7 10
Numerator for diluted
earnings per share $11,959 $7,363 $4,796
Denominators (000,000)
Denominator for basic earnings
per share:
Weighted-average number
of common shares outstanding 6,127 3,882 3,368
Dilutive potential common shares:
Stock options 24 4 1
Other stock-based compensation 19 16 10
Denominator for diluted
earnings per share 6,170 3,902 3,379
Basic earnings per share $ 1.95 $ 1.89 $ 1.42
Diluted earnings per share $ 1.94 $ 1.89 $ 1.42
At December 31, 2007, 2006 and 2005, we had issued and
outstanding options to purchase approximately 231 million,
309 million and 277 million shares of AT&T common stock.
The exercise prices of options to purchase a weighted-average
of 93 million, 201 million and 257 million shares in 2007,
2006, and 2005 exceeded the average market price of AT&T
stock. Accordingly, we did not include these amounts in
determining the dilutive potential common shares for the
respective periods. At December 31, 2007, the exercise prices
of 162 million share options were below market price.
NOTE 4. SEGMENT INFORMATION
Our segments are strategic business units that offer different
products and services and are managed accordingly. We analyze
our various operating segments based on segment income
before income taxes. Interest expense, interest income and
other income (expense) – net are managed only on a total
company basis and are, accordingly, reflected only in
consolidated results. The wireless segment includes minority
interest reported as other income (expense) – net in the
consolidated statements of income. Therefore, these items
are not included in the calculation of each segment’s
percentage of our consolidated results. As a result of the
December 29, 2006 acquisition of BellSouth, we have revised
our segment reporting to represent how we now manage
our business, restating prior periods to conform to the
current segments. The customers and long-lived assets
of our reportable segments are predominantly in the
United States. We have four reportable segments: (1) wireless,
(2) wireline, (3) advertising & publishing and (4) other.
The wireless segment provides voice, data and other
wireless communications services, and includes 100% of the
results of AT&T Mobility, which was our wireless joint venture
with BellSouth prior to the December 29, 2006 acquisition
and is now a wholly-owned subsidiary of AT&T. Prior to the
acquisition, we analyzed AT&T Mobility’s revenues and
expenses under the wireless segment, and we eliminated the
wireless segment in our consolidated financial statements.
In our 2006 and prior consolidated financial statements,
we reported our 60% proportionate share of AT&T Mobility’s
results as equity in net income of affiliates.
The wireline segment provides both retail and wholesale
landline communications services, including local and long-
distance voice, switched access, Internet protocol and Internet
access data, messaging services, managed networking to
business customers, AT&T U-verseSM TV service (U-verse) and
satellite television services through our agency agreements
with EchoStar Communications Corp. (EchoStar) and the
DIRECTV Group, Inc.
The advertising & publishing segment includes our directory
operations, which publish Yellow and White Pages directories
and sell directory and Internet-based advertising. This segment
also includes the results of YPC, which was a joint venture with
BellSouth prior to the December 29, 2006 acquisition and is
now a wholly-owned subsidiary of AT&T. For segment reporting
disclosure, we have carried forward the deferred revenue and
deferred cost balances for BellSouth at the acquisition date in
order to reflect how the segment is managed. This is different
for consolidated reporting purposes as under FAS 141,
BellSouth deferred revenue and expenses from directories
published during the 12-month period ending with the
December 29, 2006 acquisition date, are not recognized and
therefore were not included in the opening balance sheet.
For management reporting purposes, we continue to amortize
these balances over the life of the directory. Thus, our advertis-
ing & publishing segment results in 2007 include revenue of
$964 and expenses of $308, related to directories published in
the Southeast region during 2006, prior to our acquisition of
BellSouth. These amounts are eliminated in the consolidations
and eliminations column in the reconciliation below.
The other segment includes results from Sterling
Commerce, Inc., customer information services and all
corporate and other operations. This segment includes
our portion of the results from our international equity
investments. Prior to December 29, 2006, this segment
also included our results from AT&T Mobility as equity in
net income of affiliates, as discussed above.
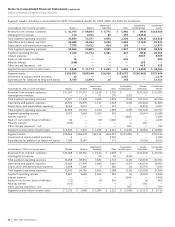
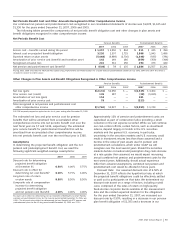
In the following tables, we show how our segment results
are reconciled to our consolidated results reported in accor-
dance with GAAP. The Wireless, Wireline, Advertising & Publish-
ing and Other columns represent the segment results of each
such operating segment. The Consolidation and Elimination
column adds in those line items that we manage on a consoli-
dated basis only: interest expense, interest income and other
income (expense) – net. This column also eliminates any
intercompany transactions included in each segment’s results
as well as the advertising & publishing revenue and expenses in
2007 related to directories published in the Southeast region
during 2006, mentioned previously. In 2006, since our 60%
share of the results from AT&T Mobility is already included in
the Other column, the Wireless Elimination column removes the
non-consolidated results shown in the wireless segment.