AT&T Uverse 2007 Annual Report Download - page 38
Download and view the complete annual report
Please find page 38 of the 2007 AT&T Uverse annual report below. You can navigate through the pages in the report by either clicking on the pages listed below, or by using the keyword search tool below to find specific information within the annual report.-
 1
1 -
2
-
3
-
4
-
5
-
6
-
7
-
8
-
9
-
10
-
11
-
12
-
13
-
14
-
15
-
16
-
17
-
18
-
19
-
20
-
21
-
22
-
23
-
24
-
25
-
26
-
27
-
 28
28 -
 29
29 -
 30
30 -
 31
31 -
 32
32 -
 33
33 -
 34
34 -
 35
35 -
 36
36 -
 37
37 -
 38
38 -
 39
39 -
 40
40 -
 41
41 -
 42
42 -
 43
43 -
 44
44 -
 45
45 -
 46
46 -
 47
47 -
 48
48 -
49
-
50
-
51
-
52
-
53
-
54
-
55
-
56
-
57
-
58
-
59
-
60
-
61
-
62
-
63
-
64
-
65
-
66
-
67
-
68
-
69
-
70
-
71
-
72
-
73
-
74
-
75
-
76
-
77
-
78
-
79
-
80
-
81
-
82
-
83
-
84
-
85
-
86
-
87
-
88
 |
 |

Management’s Discussion and Analysis of Financial Condition and Results of Operations (continued)
Dollars in millions except per share amounts
36
| 2007 AT&T Annual Report
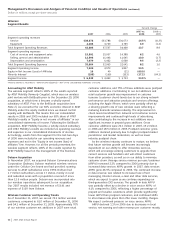
Advertising & Publishing
Segment Results
Percent Change
2007 vs. 2006 vs.
2007 2006 2005 2006 2005
Total Segment Operating Revenues $5,851 $3,685 $3,684 58.8% —
Segment operating expenses
Cost of sales 1,733 1,121 1,104 54.6 1.5
Selling, general and administrative 1,333 616 581 — 6.0
Depreciation and amortization 924 3 5 — (40.0)
Total Segment Operating Expenses 3,990 1,740 1,690 — 3.0
Segment Operating Income 1,861 1,945 1,994 (4.3) (2.5)
Equity in Net Income (Loss) of Affiliates — (17) (5) — —
Segment Income $1,861 $1,928 $1,989 (3.5)% (3.1)%
Operating revenues increased $2,166, or 58.8%, in 2007,
primarily due to the addition of BellSouth’s operating results,
which increased operating revenues approximately $2,220 in
2007. The increase was largely driven by print advertising
revenue of $1,859 and Internet advertising revenue of $200.
Operating revenues in 2006 remained relatively unchanged.
Operating expenses increased $2,250 in 2007 compared
to $50, or 3.0%, in 2006 primarily due to the addition of
BellSouth’s operating results, which increased total operating
expenses by approximately $2,110 in 2007. The increase in
2006 was primarily due to higher costs for Internet traffic,
brand advertising and employee benefits.
Cost of sales increased $612, or 54.6%, in 2007 compared
to $17, or 1.5%, in 2006, primarily due to the addition of
BellSouth’s operating results, which increased cost of sales by
approximately $550 in 2007. Publishing, commissions, paper
and printing costs represent the majority of cost of sales
expenses in 2007. The increase in 2006 was primarily due
to higher costs for Internet traffic.
Selling, general and administrative expenses increased
$717 in 2007 compared to $35, or 6.0%, in 2006 primarily
due to the addition of BellSouth’s operating results, which
increased selling, general and administrative expenses by
approximately $645 in 2007. Employee, uncollectible and
advertising-related expenses represent the majority of
selling, general and administrative expenses in 2007.
Increased expenses in 2006 were primarily due to increases
in other advertising & publishing segment costs, including
brand advertising and employee benefits of $102, partially
offset by lower bad-debt expense of $74.
Depreciation and amortization expenses increased
$921 in 2007, resulting from the amortization of customer
lists acquired as a part of the BellSouth acquisition, which
increased expenses by $915 in 2007. Depreciation and
amortization expenses in 2006 remained relatively
unchanged.
Ingenio Acquisition
In December 2007, we acquired Ingenio®, a provider of Pay
Per Call® technology. Ingenio will be integrated with YPC
and will allow us to better serve business directory and
local search customers across our entire advertising and
publishing portfolio.
Accounting Impacts From the BellSouth Acquisition
Prior to the BellSouth acquisition (see Note 2), we accounted
for our 66% economic interest in YPC under the equity
method since we shared control equally with BellSouth.
Following the BellSouth acquisition, YPC became a wholly-
owned subsidiary of AT&T and its results are reflected in
operating revenues and expenses in our consolidated
statement of income.
For segment disclosure purposes, we have carried forward
deferred revenue and deferred cost balances for BellSouth in
order to reflect how the segment is managed. This is different
from consolidated reporting purposes as under FAS 141
BellSouth deferred revenue and expenses from directories
published during the 12-month period ending with the
December 29, 2006 acquisition date are not recognized
and therefore were not included in the opening balance
sheet (see Note 4). For management reporting purposes,
we continued to amortize these balances over the life of
the directory (typically 12 months). Thus, our advertising
& publishing segment results include revenue of $964 and
expenses of $308 in 2007 related to directories published
in the Southeast region during 2006, prior to our acquisition
of BellSouth.
Operating Results
Our advertising & publishing segment operating income
margin was 31.8% in 2007, 52.8% in 2006 and 54.1% in 2005.
The decrease in the segment operating income margin in
2007 was primarily due to the addition of BellSouth’s
operating results, including the amortization of BellSouth’s
customer lists acquired as a part of the acquisition. The
decrease in the segment operating income margin in 2006
was primarily the result of increased operating expenses.