AT&T Uverse 2007 Annual Report Download - page 34
Download and view the complete annual report
Please find page 34 of the 2007 AT&T Uverse annual report below. You can navigate through the pages in the report by either clicking on the pages listed below, or by using the keyword search tool below to find specific information within the annual report.-
 1
1 -
2
-
3
-
4
-
5
-
6
-
7
-
8
-
9
-
10
-
11
-
12
-
13
-
14
-
15
-
16
-
17
-
18
-
19
-
20
-
21
-
22
-
23
-
 24
24 -
 25
25 -
 26
26 -
 27
27 -
 28
28 -
 29
29 -
 30
30 -
 31
31 -
 32
32 -
 33
33 -
 34
34 -
 35
35 -
 36
36 -
 37
37 -
 38
38 -
 39
39 -
 40
40 -
 41
41 -
 42
42 -
 43
43 -
 44
44 -
45
-
46
-
47
-
48
-
49
-
50
-
51
-
52
-
53
-
54
-
55
-
56
-
57
-
58
-
59
-
60
-
61
-
62
-
63
-
64
-
65
-
66
-
67
-
68
-
69
-
70
-
71
-
72
-
73
-
74
-
75
-
76
-
77
-
78
-
79
-
80
-
81
-
82
-
83
-
84
-
85
-
86
-
87
-
88
 |
 |

32
| 2007 AT&T Annual Report
Management’s Discussion and Analysis of Financial Condition and Results of Operations (continued)
Dollars in millions except per share amounts
Selling, general and administrative expenses increased
$1,148, or 10.0%, in 2007 and decreased $199, or 1.7%,
in 2006.
The increase in selling, general and administrative
expenses in 2007 was due to the following:
• Increases in selling expenses of $572 due to increases
in sales and advertising expenses and Apple iPhone-
related costs, partially offset by a decrease in net
commission expense, which was consistent with the
increase in prepaid plan sales as a percentage of total
retail sales.
• Increases of $572 in customer service and other expenses
primarily due to increased bad-debt expense of $338 and
other support costs of $234, partially offset by a decline
of $191 in billing expenses, lower information technology
(IT) costs and customer service expenses.
• Increases in upgrade commission and residual expenses
of $195 due to increased prepaid plan costs and higher
handset upgrade activity.
The decline in selling, general and administrative expenses
in 2006 was due to the following:
• Decreases in billing and bad-debt expense of $378
primarily due to fewer account write-offs and cost-
savings related to transitioning to one billing system.
• Decreases in other administrative expense of $106 due
to a decline in legal-related expenses, lower employee
costs and employee-related benefits due to a decrease
in the number of employees, lower IT and other
professional services expense and a federal excise
tax refund accrual.
• Decreases in customer service expense of $87 due
to a decline in the number of outsourced call center
professionals and lower billing expenses.
• Increases of $147 primarily related to increased prepaid
card replenishment costs and higher migration and
upgrade transaction costs.
• Increases in other expense of $129 due to higher
warranty, refurbishment and freight costs.
• Increases in selling expense of $96 due to an increase
in sales expense, partially offset by a decrease in net
commission expenses. The decline in net commission
expense was due to reductions in average activation and
agent branding expense, partially offset by an increase
in direct commission expense.
The expenses above also include merger integration
costs of $123 in 2006, such as employee-termination costs,
rebranding and advertising and customer service and
systems integration costs.
Depreciation and amortization increased $617, or 9.5%,
in 2007 and decreased $146, or 2.2%, in 2006. The increase
in 2007 was primarily due to an increase of $1,522 in
amortization of identifiable intangible assets related to our
acquisition of BellSouth’s 40% ownership interest, partially
offset by declining amortization of identifiable AT&T Wireless
Services, Inc. (AWE) intangible assets acquired by AT&T
Mobility in 2004, which are principally amortized using the
sum-of-the-months-digits method of amortization. Expenses
also increased due to accelerated depreciation on TDMA
assets and ongoing capital spending for network upgrades
and expansion. The 2007 increase was partially offset by
decreases in depreciation expense of $905 in 2007 due
to certain network assets becoming fully depreciated and
purchase accounting adjustments on certain network
assets related to acquiring BellSouth’s 40% ownership
interest of AT&T Mobility.
The decline in 2006 was due to a decline in amortization
expenses of $449 attributable to the AWE intangible assets
mentioned above, which are amortized using an accelerated
method of amortization. This decline was partially offset by an
increase in depreciation expense of $303 in 2006 primarily
due to depreciation associated with the property, plant and
equipment related to ongoing capital spending for our GSM
network, which was slightly offset by expense declines due
to equipment that had become fully depreciated in 2006.
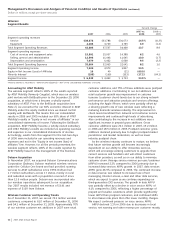
Wireline
Segment Results
Percent Change
2007 vs. 2006 vs.
2007 2006 2005 2006 2005
Segment operating revenues
Voice $41,630 $33,714 $24,180 23.5% 39.4%
Data 24,075 18,317 10,783 31.4 69.9
Other 5,872 5,447 3,491 7.8 56.0
Total Segment Operating Revenues 71,577 57,478 38,454 24.5 49.5
Segment operating expenses
Cost of sales 30,214 26,693 17,464 13.2 52.8
Selling, general and administrative 16,180 13,185 9,875 22.7 33.5
Depreciation and amortization 13,411 9,676 7,426 38.6 30.3
Total Segment Operating Expenses 59,805 49,554 34,765 20.7 42.5
Segment Income $11,772 $ 7,924 $ 3,689 48.6% —