Xcel Energy 2006 Annual Report Download - page 98
Download and view the complete annual report
Please find page 98 of the 2006 Xcel Energy annual report below. You can navigate through the pages in the report by either clicking on the pages listed below, or by using the keyword search tool below to find specific information within the annual report.-
 1
1 -
2
-
3
-
4
-
5
-
6
-
7
-
8
-
9
-
10
-
11
-
12
-
13
-
14
-
15
-
16
-
17
-
18
-
19
-
20
-
21
-
22
-
23
-
24
-
25
-
26
-
27
-
28
-
29
-
30
-
31
-
32
-
33
-
34
-
35
-
36
-
37
-
38
-
39
-
40
-
41
-
42
-
43
-
44
-
45
-
46
-
47
-
48
-
49
-
50
-
51
-
52
-
53
-
54
-
55
-
56
-
57
-
58
-
59
-
60
-
61
-
62
-
63
-
64
-
65
-
66
-
67
-
68
-
69
-
70
-
71
-
72
-
73
-
74
-
75
-
76
-
77
-
78
-
79
-
80
-
81
-
82
-
83
-
84
-
85
-
86
-
87
-
 88
88 -
 89
89 -
 90
90 -
 91
91 -
 92
92 -
 93
93 -
 94
94 -
 95
95 -
 96
96 -
 97
97 -
 98
98 -
 99
99 -
 100
100 -
 101
101 -
 102
102 -
 103
103 -
 104
104 -
 105
105 -
 106
106 -
 107
107 -
 108
108 -
109
-
110
-
111
-
112
-
113
-
114
-
115
-
116
-
117
-
118
-
119
-
120
-
121
-
122
-
123
-
124
-
125
-
126
-
127
-
128
-
129
-
130
-
131
-
132
-
133
-
134
-
135
-
136
-
137
-
138
-
139
-
140
-
141
-
142
-
143
-
144
-
145
-
146
-
147
-
148
-
149
-
150
-
151
-
152
-
153
-
154
-
155
-
156
 |
 |

88
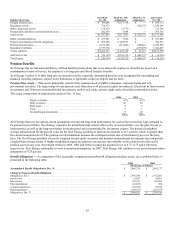
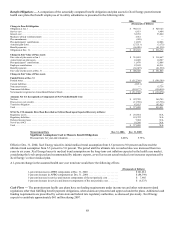
Benefit Obligations — A comparison of the actuarially computed benefit obligation and plan assets for Xcel Energy postretirement
health care plans that benefit employees of its utility subsidiaries is presented in the following table:
2006 2005
(Thousands of Dollars)
Change in Benefit Obligation
Obligation at Jan. 1 ...................................................................... $ 938,172 $ 929,125
Service cost............................................................................ 6,633 6,684
Interest cost............................................................................ 52,939 55,060
Medicare subsidy reimbursements ........................................................... 3,561
—
Plan amendments........................................................................ (945)
—
Plan participants’ contributions.............................................................. 11,870 12,008
Actuarial gain (loss)...................................................................... (27,511) (3,175)
Benefit payments........................................................................ (66,026) (61,530)
Obligation at Dec. 31..................................................................... $ 918,693 $ 938,172
Change in Fair Value of Plan Assets
Fair value of plan assets at Jan. 1 ............................................................ $ 351,863 $ 318,667
Actual return on plan assets ................................................................ 41,409 14,507
Plan participants’ contributions.............................................................. 11,870 12,008
Employer contributions ................................................................... 67,188 68,211
Benefit payments........................................................................ (66,025) (61,530)
Fair value of plan assets at Dec. 31........................................................... $ 406,305 $ 351,863
Change in Fair Value of Plan Assets
Funded Status at Dec. 31
Funded status........................................................................... $ (512,388) $ (586,309)
Current liabilities ........................................................................ (2,211)
—
Noncurrent assets........................................................................ — 15,736
Noncurrent liabilities ..................................................................... (510,177) (150,014)
Net amounts recognized on Consolidated Balance Sheets .......................................... $ (512,388) $ (134,278)
Amounts Not Yet Recognized as Components of Net Periodic Benefit Cost:
Net loss............................................................................... $ 297,745 364,745
Prior service cost (credit).................................................................. (13,558) (15,736)
Transition obligation ..................................................................... 87,633 103,022
Total................................................................................. $ 371,820 452,031
SFAS No. 158 Amounts Have Been Recorded as Follows Based upon Expected Recovery in Rates:
Regulatory assets........................................................................ $ 235,834 N/A
Regulatory liabilities ..................................................................... 118,722 N/A
Deferred income taxes.................................................................... 7,004 N/A
Net-of-tax AOCI........................................................................ 10,260 N/A
Total................................................................................. $ 371,820 N/A
Measurement Date Dec. 31, 2006 Dec. 31, 2005
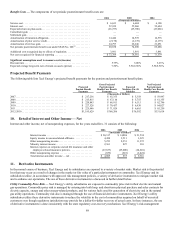
Significant Assumptions Used to Measure Benefit Obligations
Discount rate for year-end valuation............................... 6.00 % 5.75%
Effective Dec. 31, 2004, Xcel Energy raised its initial medical trend assumption from 6.5 percent to 9.0 percent and lowered the
ultimate trend assumption from 5.5 percent to 5.0 percent. The period until the ultimate rate is reached also was increased from two
years to six years. Xcel Energy bases its medical trend assumption on the long-term cost inflation expected in the health care market,
considering the levels projected and recommended by industry experts, as well as recent actual medical cost increases experienced by
Xcel Energy’s retiree medical plan.
A 1-percent change in the assumed health care cost trend rate would have the following effects:
(Thousands of Dollars)
1-percent increase in APBO components at Dec. 31, 2006 ....................... $ 101,014
1-percent decrease in APBO components at Dec. 31, 2006 ....................... $ (84,398)
1-percent increase in service and interest components of the net periodic cost ........ $ 7,985
1-percent decrease in service and interest components of the net periodic cost ........ $ (6,533)
Cash Flows — The postretirement health care plans have no funding requirements under income tax and other retirement-related
regulations other than fulfilling benefit payment obligations, when claims are presented and approved under the plans. Additional cash
funding requirements are prescribed by certain state and federal rate regulatory authorities, as discussed previously. Xcel Energy
expects to contribute approximately $61 million during 2007.