Xcel Energy 2006 Annual Report Download - page 111
Download and view the complete annual report
Please find page 111 of the 2006 Xcel Energy annual report below. You can navigate through the pages in the report by either clicking on the pages listed below, or by using the keyword search tool below to find specific information within the annual report.-
 1
1 -
2
-
3
-
4
-
5
-
6
-
7
-
8
-
9
-
10
-
11
-
12
-
13
-
14
-
15
-
16
-
17
-
18
-
19
-
20
-
21
-
22
-
23
-
24
-
25
-
26
-
27
-
28
-
29
-
30
-
31
-
32
-
33
-
34
-
35
-
36
-
37
-
38
-
39
-
40
-
41
-
42
-
43
-
44
-
45
-
46
-
47
-
48
-
49
-
50
-
51
-
52
-
53
-
54
-
55
-
56
-
57
-
58
-
59
-
60
-
61
-
62
-
63
-
64
-
65
-
66
-
67
-
68
-
69
-
70
-
71
-
72
-
73
-
74
-
75
-
76
-
77
-
78
-
79
-
80
-
81
-
82
-
83
-
84
-
85
-
86
-
87
-
88
-
89
-
90
-
91
-
92
-
93
-
94
-
95
-
96
-
97
-
98
-
99
-
100
-
 101
101 -
 102
102 -
 103
103 -
 104
104 -
 105
105 -
 106
106 -
 107
107 -
 108
108 -
 109
109 -
 110
110 -
 111
111 -
 112
112 -
 113
113 -
 114
114 -
 115
115 -
 116
116 -
 117
117 -
 118
118 -
 119
119 -
 120
120 -
 121
121 -
122
-
123
-
124
-
125
-
126
-
127
-
128
-
129
-
130
-
131
-
132
-
133
-
134
-
135
-
136
-
137
-
138
-
139
-
140
-
141
-
142
-
143
-
144
-
145
-
146
-
147
-
148
-
149
-
150
-
151
-
152
-
153
-
154
-
155
-
156
 |
 |

101
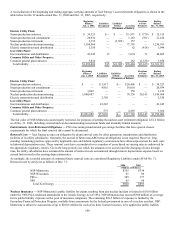
At Dec. 31, 2006, the estimated future payments for capacity that the utility subsidiaries of Xcel Energy are obligated to purchase,
subject to availability, are as follows:
(Millions of Dollars)
2007 ..................................................................... $ 552.9
2008 ..................................................................... 591.2
2009 ..................................................................... 626.2
2010 ..................................................................... 614.6
2011 ..................................................................... 606.6
2012 and thereafter ......................................................... 4,240.4
Total ................................................................... $7,231.9
Environmental Contingencies
Xcel Energy and its subsidiaries have been, or are currently involved with, the cleanup of contamination from certain hazardous
substances at several sites. In many situations, the subsidiary involved believes it will recover some portion of these costs through
insurance claims. Additionally, where applicable, the subsidiary involved is pursuing, or intends to pursue, recovery from other
potentially responsible parties and through the rate regulatory process. New and changing federal and state environmental mandates
can also create added financial liabilities for Xcel Energy and its subsidiaries, which are normally recovered through the rate
regulatory process. To the extent any costs are not recovered through the options listed above, Xcel Energy would be required to
recognize an expense.
Site Remediation — Xcel Energy must pay all or a portion of the cost to remediate sites where past activities of its subsidiaries and
some other parties have caused environmental contamination. Environmental contingencies could arise from various situations,
including the following categories of sites:
• Sites of former MGPs operated by Xcel Energy subsidiaries or predecessors; and
• Third-party sites, such as landfills, to which Xcel Energy is alleged to be a potentially responsible party (PRP) that sent
hazardous materials and wastes.
Xcel Energy records a liability when enough information is obtained to develop an estimate of the cost of environmental remediation
and revises the estimate as information is received. The estimated remediation cost may vary materially.
To estimate the cost to remediate these sites, assumptions are made when facts are not fully known. For instance, assumptions may be
made about the nature and extent of site contamination, the extent of required cleanup efforts, costs of alternative cleanup methods and
pollution-control technologies, the period over which remediation will be performed and paid for, changes in environmental
remediation and pollution-control requirements, the potential effect of technological improvements, the number and financial strength
of other PRPs and the identification of new environmental cleanup sites.
Estimates are revised as facts become known. At Dec. 31, 2006, the liability for the cost of remediating these sites was estimated to be
$30.8 million, of which $5.3 million was considered to be a current liability. Some of the cost of remediation may be recovered from:
• Insurance coverage;
• Other parties that have contributed to the contamination; and
• Customers.
Neither the total remediation cost nor the final method of cost allocation among all PRPs of the unremediated sites has been
determined. Estimates have been recorded for Xcel Energy’s future costs for these sites.
Manufactured Gas Plant Sites
Ashland Manufactured Gas Plant Site — NSP-Wisconsin was named a PRP for creosote and coal tar contamination at a site in
Ashland, Wis. The Ashland site includes property owned by NSP-Wisconsin, which was previously an MGP facility, and two other
properties: an adjacent city lakeshore park area, on which an unaffiliated third party previously operated a sawmill, and an area of
Lake Superior’s Chequemegon Bay adjoining the park.
On Sept. 5, 2002, the Ashland site was placed on the National Priorities List (NPL). A determination of the scope and cost of the
remediation of the Ashland site is not currently expected until late 2007 or 2008 following the submission of the remedial
investigation report and feasibility study in 2007. NSP-Wisconsin continues to work with the WDNR to access state and federal funds
to apply to the ultimate remediation cost of the entire site. In November 2005, the EPA Superfund Innovative Technology Evaluation
Program (SITE) accepted the Ashland site into its program. As part of the SITE program, NSP-Wisconsin proposed to perform a site
demonstration of an in situ, chemical oxidation technique to treat upland ground water and contaminated soil. During the third quarter
of 2006, the proposal was favorably reviewed by EPA, and in November 2006 the demonstration study was initiated. In 2006, NSP-
Wisconsin spent $2.0 million in the development of the work plan, the interim response action and other matters related to the site.