Xcel Energy 2006 Annual Report Download - page 90
Download and view the complete annual report
Please find page 90 of the 2006 Xcel Energy annual report below. You can navigate through the pages in the report by either clicking on the pages listed below, or by using the keyword search tool below to find specific information within the annual report.-
 1
1 -
2
-
3
-
4
-
5
-
6
-
7
-
8
-
9
-
10
-
11
-
12
-
13
-
14
-
15
-
16
-
17
-
18
-
19
-
20
-
21
-
22
-
23
-
24
-
25
-
26
-
27
-
28
-
29
-
30
-
31
-
32
-
33
-
34
-
35
-
36
-
37
-
38
-
39
-
40
-
41
-
42
-
43
-
44
-
45
-
46
-
47
-
48
-
49
-
50
-
51
-
52
-
53
-
54
-
55
-
56
-
57
-
58
-
59
-
60
-
61
-
62
-
63
-
64
-
65
-
66
-
67
-
68
-
69
-
70
-
71
-
72
-
73
-
74
-
75
-
76
-
77
-
78
-
79
-
 80
80 -
 81
81 -
 82
82 -
 83
83 -
 84
84 -
 85
85 -
 86
86 -
 87
87 -
 88
88 -
 89
89 -
 90
90 -
 91
91 -
 92
92 -
 93
93 -
 94
94 -
 95
95 -
 96
96 -
 97
97 -
 98
98 -
 99
99 -
 100
100 -
101
-
102
-
103
-
104
-
105
-
106
-
107
-
108
-
109
-
110
-
111
-
112
-
113
-
114
-
115
-
116
-
117
-
118
-
119
-
120
-
121
-
122
-
123
-
124
-
125
-
126
-
127
-
128
-
129
-
130
-
131
-
132
-
133
-
134
-
135
-
136
-
137
-
138
-
139
-
140
-
141
-
142
-
143
-
144
-
145
-
146
-
147
-
148
-
149
-
150
-
151
-
152
-
153
-
154
-
155
-
156
 |
 |

80
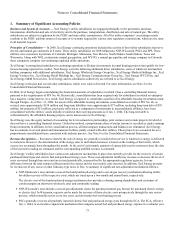
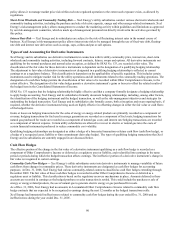
PSCo’s current operational assets include approximately 320 MWs of jointly owned generating capacity. PSCo’s share of operating
expenses and construction expenditures are included in the applicable utility accounts. PSCo began major construction on a new
jointly owned 750 MW, coal-fired unit in Pueblo, Colo. in January 2006. Major construction on the new unit, Comanche 3, is
expected to be completed in the fall of 2009. PSCo is the operating agent under the joint ownership agreement. Each of the respective
owners is responsible for the issuance of its own securities to finance its portion of the construction costs. For Comanche unit 3, the
ownership percentage for Xcel Energy decreased in May 2006 from 74.7 percent to 66.7 percent for the project life-to-date and going
forward.
Nuclear Plant Operation — The NMC is an operating company that manages the operations, maintenance and physical security of
several nuclear generating units, including three units/two sites owned by NSP-Minnesota. NSP-Minnesota continues to own the
plants, controls all energy produced by the plants and retains responsibility for nuclear property, liability insurance, spent fuel and
decommissioning costs. As of Dec. 31, 2006, all members of the NMC, other than Xcel Energy, have chosen to sell their units and exit the
NMC. Regarding the remaining members of the NMC, the sales transaction of CMS Energy Corp Palisades Nuclear Power Plant is
targeted to close in the first quarter of 2007. In December 2006, Wisconsin Electric Power Co., announced its intent to sell its Point Beach
Nuclear Plant to FPL Energy with the sale expected to close in the third or fourth quarter of 2007.
Following consummation of the sale transactions, NSP-Minnesota will be the sole remaining member of the NMC. NSP-Minnesota is
evaluating the situation. One option under consideration is to transition the NMC to a wholly owned subsidiary of Xcel Energy. To
facilitate implementation of this option, Xcel Energy plans are progressing to restructure the NMC to support a two-site organization,
as well as reabsorb the administrative functions within Xcel Energy by the end of 2007
In accordance with the Nuclear Power Plant Operating Services Agreement, NSP-Minnesota also pays its proportionate share of the
operating expenses and capital improvement costs incurred by NMC. NSP-Minnesota paid the NMC $292.5 million in 2006, $257.1
million in 2005 and $314.7 million in 2004.
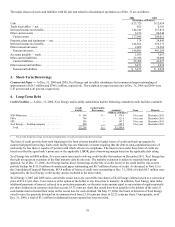
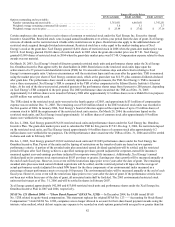
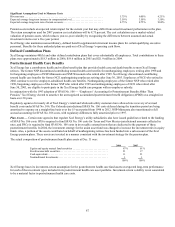
7. Income Taxes
Xcel Energy’s federal net operating loss and tax credit carry forwards are estimated to be $731 million and $135 million, respectively.
A portion of the net operating loss in the amount of $505.9 million and a portion of the tax credit carry forward in the amount of $46.1
million are accounted for in discontinued operations. The carry forward periods expire in 2023 and 2024. Xcel Energy also has state
net operating loss and tax credit carry forwards of $1.5 billion and $10 million, respectively. The state carry forward periods expire
between 2014 and 2024. A valuation allowance recorded in prior years against deferred tax assets for capital loss carry forwards
related to discontinued operations was reduced to zero during 2006 due to capital gains. The valuation allowance was $44 million as
of Dec. 31, 2005.
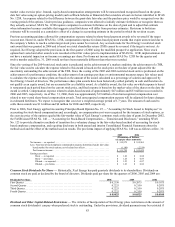
Total income tax expense from continuing operations differs from the amount computed by applying the statutory federal income tax
rate to income before income tax expense. The following is a table reconciling such differences for the years ending Dec. 31:
2006 2005 2004
Federal statutory rate.............................. 35.0% 35.0% 35.0%
Increases (decreases) in tax from:
State income taxes, net of federal income tax benefit . . . 3.0 2.5 3.3
Life insurance policies .......................... (4.7) (4.6) (4.0)
Tax credits recognized........................... (3.4) (4.4) (4.4)
Capital loss carryforward utilization................ (2.4)
—
—
Resolution of income tax audits and other ........... (1.6) (0.3) (5.3)
Regulatory differences — utility plant items.......... (0.5) (0.3) (0.1)
Other — net................................... (1.2) (2.1) (0.8)
Effective income tax rate from continuing operations..... 24.2% 25.8% 23.7%
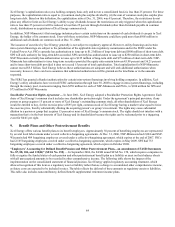
Income taxes comprise the following expense (benefit) items for the years ending Dec. 31:
2006 2005 2004
(Thousands of Dollars)
Current federal tax expense.......................... $ 209,941 $ (4,122) $ 88,514
Current state tax expense ........................... 41,119 (15,733) 32,135
Current tax credits.................................
—
(45) (3,798)
Deferred federal tax expense......................... (37,575) 191,900 67,716
Deferred state tax expense........................... (8,695) 31,235 3,574
Deferred tax credits................................ (13,573) (18,077) (14,017)
Deferred investment tax credits....................... (9,806) (11,619) (12,189)
Total income tax expense from continuing operations . . . $ 181,411 $ 173,539 $ 161,935