Xcel Energy 2006 Annual Report Download - page 125
Download and view the complete annual report
Please find page 125 of the 2006 Xcel Energy annual report below. You can navigate through the pages in the report by either clicking on the pages listed below, or by using the keyword search tool below to find specific information within the annual report.-
 1
1 -
2
-
3
-
4
-
5
-
6
-
7
-
8
-
9
-
10
-
11
-
12
-
13
-
14
-
15
-
16
-
17
-
18
-
19
-
20
-
21
-
22
-
23
-
24
-
25
-
26
-
27
-
28
-
29
-
30
-
31
-
32
-
33
-
34
-
35
-
36
-
37
-
38
-
39
-
40
-
41
-
42
-
43
-
44
-
45
-
46
-
47
-
48
-
49
-
50
-
51
-
52
-
53
-
54
-
55
-
56
-
57
-
58
-
59
-
60
-
61
-
62
-
63
-
64
-
65
-
66
-
67
-
68
-
69
-
70
-
71
-
72
-
73
-
74
-
75
-
76
-
77
-
78
-
79
-
80
-
81
-
82
-
83
-
84
-
85
-
86
-
87
-
88
-
89
-
90
-
91
-
92
-
93
-
94
-
95
-
96
-
97
-
98
-
99
-
100
-
101
-
102
-
103
-
104
-
105
-
106
-
107
-
108
-
109
-
110
-
111
-
112
-
113
-
114
-
 115
115 -
 116
116 -
 117
117 -
 118
118 -
 119
119 -
 120
120 -
 121
121 -
 122
122 -
 123
123 -
 124
124 -
 125
125 -
 126
126 -
 127
127 -
 128
128 -
 129
129 -
 130
130 -
 131
131 -
 132
132 -
 133
133 -
 134
134 -
 135
135 -
136
-
137
-
138
-
139
-
140
-
141
-
142
-
143
-
144
-
145
-
146
-
147
-
148
-
149
-
150
-
151
-
152
-
153
-
154
-
155
-
156
 |
 |

115
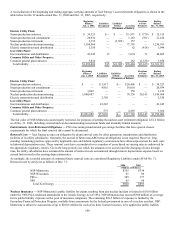
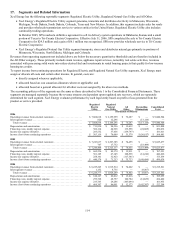
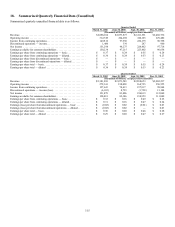
18. Summarized Quarterly Financial Data (Unaudited)
Summarized quarterly unaudited financial data is as follows:
Quarter Ended
March 31, 2006 June 30, 2006 Sept. 30, 2006 Dec. 31, 2006
(Thousands of Dollars, except per share amounts)
Revenue................................................... $ 2,888,104 $ 2,073,873 $ 2,411,591 $ 2,466,736
Operating income ........................................... 312,749 224,658 410,103 229,482
Income from continuing operations.............................. 149,812 97,936 224,175 96,758
Discontinued operations — income.............................. 1,486 339 287 960
Net income ................................................ 151,298 98,275 224,462 97,718
Earnings available for common shareholders ...................... 150,238 97,215 223,402 96,658
Earnings per share from continuing operations — basic.............. $ 0.37 $ 0.24 $ 0.55 $ 0.24
Earnings per share from continuing operations — diluted............. $ 0.36 $ 0.24 $ 0.53 $ 0.23
Earnings per share from discontinued operations — basic ............ $
—
$
—
$
—
$ —
Earnings per share from discontinued operations — diluted........... $
—
$
—
$
—
$ —
Earnings per share total — basic................................ $ 0.37 $ 0.24 $ 0.55 $ 0.24
Earnings per share total — diluted .............................. $ 0.36 $ 0.24 $ 0.53 $ 0.23
Quarter Ended
March 31, 2005 June 30, 2005 Sept. 30, 2005 Dec. 31, 2005
(Thousands of Dollars, except per share amounts)
Revenue................................................... $ 2,381,038 $ 2,073,549 $ 2,288,653 $ 2,882,237
Operating income ........................................... 279,341 198,098 364,725 250,555
Income from continuing operations.............................. 127,643 74,613 197,817 98,964
Discontinued operations — income (loss)......................... (6,165) 8,793 (1,798) 13,104
Net income ................................................ 121,478 83,406 196,019 112,068
Earnings available for common shareholders ...................... 120,418 82,346 194,959 111,008
Earnings per share from continuing operations — basic.............. $ 0.32 $ 0.18 $ 0.49 $ 0.25
Earnings per share from continuing operations — diluted............. $ 0.31 $ 0.18 $ 0.47 $ 0.24
Earnings (loss) per share from discontinued operations — basic ....... $ (0.02) $ 0.02 $ (0.01) $ 0.03
Earnings (loss) per share from discontinued operations — diluted...... $ (0.02) $ 0.02 $ — $ 0.03
Earnings per share total — basic................................ $ 0.30 $ 0.20 $ 0.48 $ 0.28
Earnings per share total — diluted .............................. $ 0.29 $ 0.20 $ 0.47 $ 0.27