Xcel Energy 2006 Annual Report Download - page 79
Download and view the complete annual report
Please find page 79 of the 2006 Xcel Energy annual report below. You can navigate through the pages in the report by either clicking on the pages listed below, or by using the keyword search tool below to find specific information within the annual report.-
 1
1 -
2
-
3
-
4
-
5
-
6
-
7
-
8
-
9
-
10
-
11
-
12
-
13
-
14
-
15
-
16
-
17
-
18
-
19
-
20
-
21
-
22
-
23
-
24
-
25
-
26
-
27
-
28
-
29
-
30
-
31
-
32
-
33
-
34
-
35
-
36
-
37
-
38
-
39
-
40
-
41
-
42
-
43
-
44
-
45
-
46
-
47
-
48
-
49
-
50
-
51
-
52
-
53
-
54
-
55
-
56
-
57
-
58
-
59
-
60
-
61
-
62
-
63
-
64
-
65
-
66
-
67
-
68
-
 69
69 -
 70
70 -
 71
71 -
 72
72 -
 73
73 -
 74
74 -
 75
75 -
 76
76 -
 77
77 -
 78
78 -
 79
79 -
 80
80 -
 81
81 -
 82
82 -
 83
83 -
 84
84 -
 85
85 -
 86
86 -
 87
87 -
 88
88 -
 89
89 -
90
-
91
-
92
-
93
-
94
-
95
-
96
-
97
-
98
-
99
-
100
-
101
-
102
-
103
-
104
-
105
-
106
-
107
-
108
-
109
-
110
-
111
-
112
-
113
-
114
-
115
-
116
-
117
-
118
-
119
-
120
-
121
-
122
-
123
-
124
-
125
-
126
-
127
-
128
-
129
-
130
-
131
-
132
-
133
-
134
-
135
-
136
-
137
-
138
-
139
-
140
-
141
-
142
-
143
-
144
-
145
-
146
-
147
-
148
-
149
-
150
-
151
-
152
-
153
-
154
-
155
-
156
 |
 |

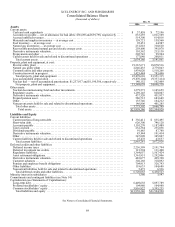
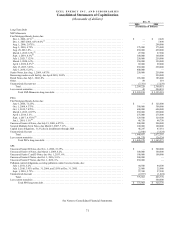
See Notes to Consolidated Financial Statements.
69
XCEL ENERGY INC. AND SUBSIDIARIES
Consolidated Balance Sheets
(thousands of dollars)
Dec. 31
2006 2005
Assets
Current assets:
Cash and cash equivalents .......................................................... $ 37,458 $ 72,196
Accounts receivable — net of allowance for bad debts: $36,689 and $39,798, respectively ..... 833,293 1,011,569
Accrued unbilled revenues .......................................................... 514,300 614,016
Materials and supplies inventories — at average cost.................................... 158,721 159,560
Fuel inventory — at average cost .................................................... 95,651 64,987
Natural gas inventories — at average cost ............................................. 251,818 310,610
Recoverable purchased natural gas and electric energy costs.............................. 258,600 395,070
Derivative instruments valuation..................................................... 101,562 213,138
Prepayments and other............................................................. 205,743 99,904
Current assets held for sale and related to discontinued operations ......................... 177,040 200,811
Total current assets.............................................................. 2,634,186 3,141,861
Property, plant and equipment, at cost:
Electric utility plant ............................................................... 19,367,671 18,870,516
Natural gas utility plant ............................................................ 2,846,435 2,779,043
Common utility and other property ................................................... 1,439,020 1,518,266
Construction work in progress....................................................... 1,425,484 783,490
Total property, plant and equipment ................................................ 25,078,610 23,951,315
Less accumulated depreciation ...................................................... (9,670,104) (9,357,414)
Nuclear fuel — net of accumulated amortization: $1,237,917 and $1,190,386, respectively..... 140,152 102,409
Net property, plant and equipment.................................................. 15,548,658 14,696,310
Other assets:
Nuclear decommissioning fund and other investments................................... 1,279,573 1,145,659
Regulatory assets.................................................................. 1,189,145 820,007
Derivative instruments valuation..................................................... 437,520 451,937
Prepaid pension asset.............................................................. 586,712 683,649
Other ........................................................................... 135,746 164,212
Noncurrent assets held for sale and related to discontinued operations...................... 146,806 401,285
Total other assets................................................................ 3,775,502 3,666,749
Total assets................................................................... $21,958,346 $21,504,920
Liabilities and Equity
Current liabilities:
Current portion of long-term debt.................................................... $ 336,411 $ 835,495
Short-term debt................................................................... 626,300 746,120
Accounts payable ................................................................. 1,101,270 1,187,489
Taxes accrued.................................................................... 252,384 235,056
Dividends payable................................................................. 91,685 87,788
Derivative instruments valuation..................................................... 83,944 191,414
Other ........................................................................... 347,809 345,807
Current liabilities held for sale and related to discontinued operations ...................... 25,478 43,657
Total current liabilities ........................................................... 2,865,281 3,672,826
Deferred credits and other liabilities:
Deferred income taxes ............................................................. 2,256,599 2,191,794
Deferred investment tax credits...................................................... 121,594 131,400
Regulatory liabilities............................................................... 1,364,657 1,567,424
Asset retirement obligations......................................................... 1,361,951 1,292,006
Derivative instruments valuation..................................................... 483,077 499,390
Customer advances................................................................ 302,168 310,092
Pension and employee benefit obligations ............................................. 704,913 326,793
Other liabilities ................................................................... 119,633 104,688
Noncurrent liabilities held for sale and related to discontinued operations ................... 5,473 6,936
Total deferred credits and other liabilities ............................................ 6,720,065 6,430,523
Minority interest in subsidiaries ....................................................... 1,560 3,547
Commitments and contingent liabilities (see Note 14)
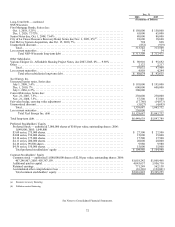
Capitalization (see Statements of Capitalization):
Long-term debt................................................................... 6,449,638 5,897,789
Preferred stockholders’ equity....................................................... 104,980 104,980
Common stockholders’ equity....................................................... 5,816,822 5,395,255
Total liabilities and equity ........................................................ $21,958,346 $21,504,920