Xcel Energy 2006 Annual Report Download - page 67
Download and view the complete annual report
Please find page 67 of the 2006 Xcel Energy annual report below. You can navigate through the pages in the report by either clicking on the pages listed below, or by using the keyword search tool below to find specific information within the annual report.-
 1
1 -
2
-
3
-
4
-
5
-
6
-
7
-
8
-
9
-
10
-
11
-
12
-
13
-
14
-
15
-
16
-
17
-
18
-
19
-
20
-
21
-
22
-
23
-
24
-
25
-
26
-
27
-
28
-
29
-
30
-
31
-
32
-
33
-
34
-
35
-
36
-
37
-
38
-
39
-
40
-
41
-
42
-
43
-
44
-
45
-
46
-
47
-
48
-
49
-
50
-
51
-
52
-
53
-
54
-
55
-
56
-
 57
57 -
 58
58 -
 59
59 -
 60
60 -
 61
61 -
 62
62 -
 63
63 -
 64
64 -
 65
65 -
 66
66 -
 67
67 -
 68
68 -
 69
69 -
 70
70 -
 71
71 -
 72
72 -
 73
73 -
 74
74 -
 75
75 -
 76
76 -
 77
77 -
78
-
79
-
80
-
81
-
82
-
83
-
84
-
85
-
86
-
87
-
88
-
89
-
90
-
91
-
92
-
93
-
94
-
95
-
96
-
97
-
98
-
99
-
100
-
101
-
102
-
103
-
104
-
105
-
106
-
107
-
108
-
109
-
110
-
111
-
112
-
113
-
114
-
115
-
116
-
117
-
118
-
119
-
120
-
121
-
122
-
123
-
124
-
125
-
126
-
127
-
128
-
129
-
130
-
131
-
132
-
133
-
134
-
135
-
136
-
137
-
138
-
139
-
140
-
141
-
142
-
143
-
144
-
145
-
146
-
147
-
148
-
149
-
150
-
151
-
152
-
153
-
154
-
155
-
156
 |
 |

57
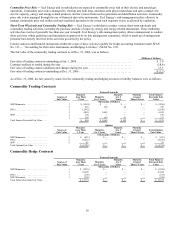
Options
Source of
Fair Value
Maturity
Less Than
1 Year
Maturity
1 to 3 Years
Maturity
4 to 5
Years
Maturity
Greater
Than 5 Years
Total Options
Fair Value
(Thousands of Dollars)
NSP-Minnesota................... 2 $ 514 $
—
$
—
$
—
$ 514
PSCo........................... 2 3,241
—
—
—
3,241
NSP-Wisconsin................... 2 20
—
—
—
20
Total Options Fair Value............ $ 3,775 $
—
$
—
$
—
$ 3,775
1
—
Prices actively quoted or based on actively quoted prices.
2
—
Prices based on models and other valuation methods. These represent the fair value of positions calculated using internal models when directly and indirectly quoted
external prices or prices derived from external sources are not available. Internal models incorporate the use of options pricing and estimates of the present value of cash
flows based upon underlying contractual terms. The models reflect management’s estimates, taking into account observable market prices, estimated market prices in the
absence of quoted market prices, the risk-free market discount rate, volatility factors, estimated correlations of commodity prices and contractual volumes. Market price
uncertainty and other risks also are factored into the model.
*
—
SPS conducts an inconsequential amount of commodity trading. Margins from commodity trading activity are partially redistributed to SPS, NSP-Minnesota, and PSCo,
pursuant to the JOA approved by the FERC. As a result of the JOA, margins received pursuant to the JOA are reflected as part of the fair values by source for the
commodity trading net asset or liability balances.
Normal purchases and sales transactions, as defined by SFAS No. 133 and certain other long-term power purchase contracts are not
included in the fair values by source tables as they are not recorded at fair value as part of commodity trading operations and are not
qualifying hedges.
At Dec. 31, 2006, a 10-percent increase in market prices over the next 12 months for commodity trading contracts would increase
pretax income from continuing operations by approximately $0.9 million, whereas a 10-percent decrease would decrease pretax
income from continuing operations by approximately $1.1 million.
Xcel Energy’s short-term wholesale and commodity trading operations measure the outstanding risk exposure to price changes on
transactions, contracts and obligations that have been entered into, but not closed, using an industry standard methodology known as
VaR. VaR expresses the potential change in fair value on the outstanding transactions, contracts and obligations over a particular
period of time, with a given confidence interval under normal market conditions. Xcel Energy utilizes the variance/covariance
approach in calculating VaR. The VaR model employs a 95-percent confidence interval level based on historical price movement,
lognormal price distribution assumption, delta half-gamma approach for non-linear instruments and a three-day holding period for
both electricity and natural gas.
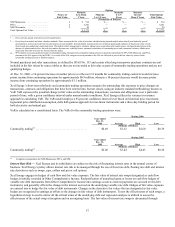
VaR is calculated on a consolidated basis. The VaRs for the commodity trading operations were:
During 2006
Year ended
Dec. 31,
2006 Average High Low
(Millions of Dollars)
Commodity trading(a) ..................................... $0.49 $1.32 $2.60 $0.39
During 2005
Year ended
Dec. 31,
2005 Average High Low
(Millions of Dollars)
Commodity trading(a) ..................................... $2.06 $1.44 $4.43 $0.26
(a) Comprises transactions for NSP-Minnesota, PSCo and SPS.
Interest Rate Risk — Xcel Energy and its subsidiaries are subject to the risk of fluctuating interest rates in the normal course of
business. Xcel Energy’s policy allows interest rate risk to be managed through the use of fixed rate debt, floating rate debt and interest
rate derivatives such as swaps, caps, collars and put or call options.
Xcel Energy engages in hedges of cash flow and fair value exposure. The fair value of interest rate swaps designated as cash flow
hedges is initially recorded in Other Comprehensive Income. Reclassification of unrealized gains or losses on cash flow hedges of
variable rate debt instruments from Other Comprehensive Income into earnings occurs as interest payments are accrued on the debt
instrument, and generally offsets the change in the interest accrued on the underlying variable rate debt. Hedges of fair value exposure
are entered into to hedge the fair value of debt instruments. Changes in the derivative fair values that are designated as fair value
hedges are recognized in earnings as offsets to the changes in fair values of debt instruments. To test the effectiveness of such swaps, a
hypothetical swap is used to mirror all the critical terms of the underlying debt and regression analysis is utilized to assess the
effectiveness of the actual swap at inception and on an ongoing basis. The fair value of interest rate swaps is determined through