XM Radio 2000 Annual Report Download - page 32
Download and view the complete annual report
Please find page 32 of the 2000 XM Radio annual report below. You can navigate through the pages in the report by either clicking on the pages listed below, or by using the keyword search tool below to find specific information within the annual report.-
 1
1 -
2
-
3
-
4
-
5
-
6
-
7
-
8
-
9
-
10
-
11
-
12
-
13
-
14
-
15
-
16
-
17
-
18
-
19
-
20
-
21
-
 22
22 -
 23
23 -
 24
24 -
 25
25 -
 26
26 -
 27
27 -
 28
28 -
 29
29 -
 30
30 -
 31
31 -
 32
32 -
 33
33 -
 34
34 -
 35
35 -
 36
36 -
 37
37 -
 38
38 -
 39
39 -
 40
40 -
 41
41 -
 42
42 -
43
-
44
-
45
-
46
-
47
-
48
-
49
-
50
-
51
-
52
-
53
 |
 |

FiNANCiALS 2000
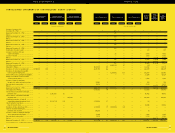
CONSOLiDATED STATEMENTS OF STOCKHOLDERS’ EQUiTY (DEFiCiT)
(In thousands, except share data) (In thousands, except share data)
Issuance of common stock
(December 15, 1992) .................................... — $ — — $ — — $ — — $ — 100 $ — — $ — $ — $ — $ —
Balance at December 31, 1992 ...................... — — — — — — — — 100 — — — — — —
Net loss ........................................................ — — — — — — — — — — — — — — —
Balance at December 31, 1993 ...................... — — — — — — — — 100 — — — — — —
Net loss ........................................................ — — — — — — — — — — — — — — —
Balance at December 31, 1994 ...................... — — — — — — — — 100 — — — — — —
Net loss ........................................................ — — — — — — — — — — — — — — —
Balance at December 31, 1995 ...................... — — — — — — — — 100 — — — — — —
Net loss ........................................................ — — — — — — — — — — — — — — —
Balance at December 31, 1996 ...................... — — — — — — — — 100 — — — — — —
Contributions to paid-in capital ........................ — — — — — — — — — — — — 143 — 143
Issuance of common stock and
capital contributions.................................... — — — — — — — — 25 — — — 9,000 — 9,000
Issuance of options ........................................ — — — — — — — — — — — — 1,500 — 1,500
Net loss ........................................................ — — — — — — — — — — — — — (1,659) (1,659)
Balance at December 31, 1997 ...................... — — — — — — — — 125 — — — 10,643 (1,659) 8,984
Net loss ........................................................ — — — — — — — — — — — — — (16,167) (16,167)
Balance at December 31, 1998 ...................... — — — — — — — — 125 — — — 10,643 (17,826) (7,183)
53,514-for-one stock split .............................. — — — — — — — — 6,689,125 67 — — (67) — —
Initial public offering ........................................ — — — — — — 10,241,000 102 — — — — 114,032 — 114,134
Conversion of Series A convertible debt .......... 10,786,504 108 — — — — 16,179,755 162 — — — — 246,079 — 246,349
Conversion of subordinated convertible
notes payable to related party .................... — — — — — — — — 11,182,926 112 — — 106,843 — 106,955
Increase in FCC license, goodwill and intangibles .. — — — — — — — — — — — — 51,624 — 51,624
Charge for beneficial conversion feature
of note issued to Parent.............................. — — — — — — — — — — — — 5,520 — 5,520
Issuance of shares to employees
through stock option and purchase plans .... — — — — — — 29,862 1 — — — — 303 — 304
Non-cash stock compensation ........................ — — — — — — 14,716 — — — — — 4,210 — 4,210
Net loss ........................................................ — — — — — — — — — — — — — (36,896) (36,896)
Balance at December 31, 1999 ...................... 10,786,504 108 — — — — 26,465,333 265 17,872,176 179 — — 539,187 (54,722) 485,017
Secondary public offering................................ — — — — — — 4,370,000 44 — — — — 132,026 — 132,070
Sale of Series B convertible redeemable ..........
preferred stock .......................................... — — 2,000,000 20 — — — — — — — — 96,452 — 96,472
Sale of Series C convertible redeemable
preferred stock .......................................... — — — — 235,000 2 — — — — — — 226,820 — 226,822
Incentivized conversion of Series B ................
convertible redeemable preferred stock ...... — — (1,132,711) (11) — — 1,700,016 17 — — — — (6) — —
Sale of warrants to purchase ..........................
Class A common stock .............................. — — — — — — — — — — — — 63,536 — 63,536
Conversion of Class B common stock .............. — — — — — — 1,314,914 13 (1,314,914) (13) — — — — —
Series B convertible redeemable......................
preferred stock dividends ............................ — — — — — — 145,166 1 — — — — (1) — —
Issuance of shares to employees through
stock option and purchase plans.................. — — — — — — 73,565 1 — — — — 1,164 — 1,165
Non-cash stock compensation ........................ — — — — — — 5,000 — — — — — 2,743 — 2,743
Net loss ........................................................ — — — — — — — — — — — — — (51,873) (51,873)
Balance at December 31, 2000 ...................... 10,786,504 $ 108 867,289 $ 9 235,000 $ 2 34,073,994 $ 341 16,557,262 $ 166 — $ — $1,061,921 $ (106,595) $ 955,952
See accompanying notes to consolidated financial statements.
Series B Convertible
Redeemable Preferred Stock
Series C Convertible
Redeemable Preferred Stock
Series A Convertible
Preferred Stock
Shares Amount Shares Amount Shares AmountShares Amount
Class A Common Stock Class B Common Stock
Shares Amount Shares Amount
Class C Common Stock
Additional
Paid-in
Capital
Deficit
Accumulated
During
Development
Stage
Total
Stockholders’
Equity
(Deficit)
XM SATELLiTE RADiO 2000 Annual Report 31
RADiO TO THE POWER OF X
30 XM SATELLiTE RADiO 2000 Annual Report