XM Radio 2000 Annual Report Download - page 29
Download and view the complete annual report
Please find page 29 of the 2000 XM Radio annual report below. You can navigate through the pages in the report by either clicking on the pages listed below, or by using the keyword search tool below to find specific information within the annual report.-
 1
1 -
2
-
3
-
4
-
5
-
6
-
7
-
8
-
9
-
10
-
11
-
12
-
13
-
14
-
15
-
16
-
17
-
18
-
 19
19 -
 20
20 -
 21
21 -
 22
22 -
 23
23 -
 24
24 -
 25
25 -
 26
26 -
 27
27 -
 28
28 -
 29
29 -
 30
30 -
 31
31 -
 32
32 -
 33
33 -
 34
34 -
 35
35 -
 36
36 -
 37
37 -
 38
38 -
 39
39 -
40
-
41
-
42
-
43
-
44
-
45
-
46
-
47
-
48
-
49
-
50
-
51
-
52
-
53
 |
 |

XM SATELLiTE RADiO 2000 Annual Report
FiNANCiALS 2000
27
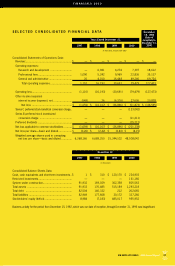
SELECTED CONSOLiDATED FiNANCiAL DATA
(In thousands, except share data)
Consolidated Statements of Operations Data:
Revenue:............................................................$ — $ — $ — $ — $ —
Operating expenses:
Research and development ............................ —6,941 4,274 7,397 18,612
Professional fees............................................ 1,090 5,242 9,969 22,836 39,137
General and administrative .............................. 20 4,010 16,448 49,246 69,724
Total operating expenses ............................ 1,110 16,193 30,691 79,479 127,473
Operating loss.................................................... (1,110) (16,193) (30,691) (79,479) (127,473)
Other income (expense)
interest income (expense), net ........................ (549) 26 (6,205) 27,606 20,878
Net loss .................................................... $ (1,659) $ (16,167) $ (36,896) $ (51,873) $ (106,595)
Series C preferred stock beneficial conversion charge.. —— —(123,042)
Series B preferred stock incentivized
conversion charge .......................................... ———(11,211)
Preferred dividends ............................................ ———(15,212)
Net loss applicable to common stockholders ..........$ (1,659) $ (16,167) $ (36,896) $ (201,338)
Net loss per share—basic and diluted..................$ (0.26) $ (2.42) $ (2.40) $ (4.15)
Weighted average shares used in computing
net loss per share—basic and diluted .............. 6,368,166 6,689,250 15,344,102 48,508,042
(In thousands)
Consolidated Balance Sheets Data:
Cash, cash equivalents and short-term investments ..$ 1 $ 310 $ 120,170 $ 224,903
Restricted investments............................................ ———161,166
System under construction...................................... 91,932 169,029 362,358 805,563
Total assets .......................................................... 91,933 170,485 515,189 1,293,218
Total debt ............................................................ 82,504 140,332 212 262,665
Total liabilities ........................................................ 82,949 177,668 30,172 337,266
Stockholders’ equity (deficit).................................... 8,984 (7,183) 485,017 955,952
Business activity for the period from December 15, 1992, which was our date of inception, through December 31, 1996 was insignificant.
Years Ended December 31,
December
15, 1992
(Date of
Inception) to
December 31,
2000
2000199919981997
December 31,
2000199919981997