XM Radio 1999 Annual Report Download - page 34
Download and view the complete annual report
Please find page 34 of the 1999 XM Radio annual report below. You can navigate through the pages in the report by either clicking on the pages listed below, or by using the keyword search tool below to find specific information within the annual report.-
 1
1 -
2
-
3
-
4
-
5
-
6
-
7
-
8
-
9
-
10
-
11
-
12
-
13
-
14
-
15
-
16
-
17
-
18
-
19
-
20
-
21
-
22
-
23
-
 24
24 -
 25
25 -
 26
26 -
 27
27 -
 28
28 -
 29
29 -
 30
30 -
 31
31 -
 32
32 -
 33
33 -
 34
34 -
 35
35 -
 36
36 -
 37
37 -
 38
38 -
 39
39 -
 40
40 -
 41
41 -
 42
42 -
 43
43 -
 44
44 -
45
-
46
-
47
-
48
-
49
-
50
-
51
-
52
-
53
-
54
-
55
-
56
 |
 |

32 XM RADi
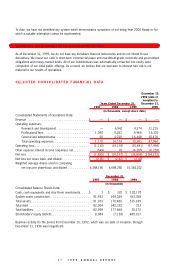
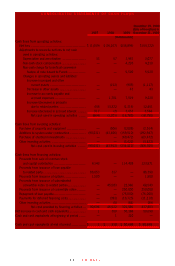
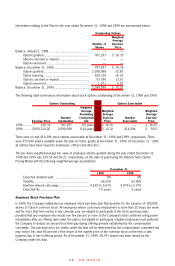
CONSOLiDATED STATEMENTS OF CASH FLOWS
December 15, 1992
(date of inception) to
1997 1998 1999 December 31, 1999
(in thousands)
Cash flows from operating activities:
Net loss ............................................................... $ (1,659) $ (16,167) $(36,896) $ (54,722)
Adjustments to reconcile net loss to net cash
used in operating activities:
Depreciation and amortization ........................... 33 57 1,987 2,077
Non-cash stock compensation ........................... — — 4,210 4,210
Non-cash charge for beneficial conversion
feature of note issued to Parent .................... — — 5,520 5,520
Changes in operating assets and liabilities:
Increase in prepaid and other
current assets ......................................... — (212) (905) (1,117)
Decrease in other assets .............................. — — 43 43
Increase in accounts payable and
accrued expenses .................................... — 1,701 7,519 9,220
Increase (decrease) in amounts
due to related parties .............................. 445 13,322 (1,316) 12,451
Increase (decrease) in accrued interest ......... 517 (2) 3,053 3,568
Net cash used in operating activities ........ (664) (1,301) (16,785) (18,750)
Cash flows from investing activities:
Purchase of property and equipment ...................... — (506) (2,008) (2,514)
Additions to system under construction .................. (90,031) (43,406) (159,510) (292,947)
Purchase of short-term investments ....................... — — (69,472) (69,472)
Other investing activities ....................................... — — (3,422) (3,422)
Net cash used in investing activities ......... (90,031) (43,912) (234,412) (368,355)
Cash flows from financing activities:
Proceeds from sale of common stock
and capital contribution ..................................... 9,143 — 114,428 123,571
Proceeds from issuance of loan payable
to related party ................................................. 80,053 337 — 80,390
Proceeds from issuance of options ......................... 1,500 — — 1,500
Proceeds from issuance of subordinated
convertible notes to related parties..................... — 45,583 22,966 68,549
Proceeds from issuance of convertible notes .......... — — 250,000 250,000
Repayment of loan payable..................................... — — (75,000) (75,000)
Payments for deferred financing costs .................... — (393) (10,725) (11,118)
Other investing activities ........................................ — (5) (84) (89)
Net cash provided by financing activities.... 90,696 45,522 301,585 437,803
Net increase in cash and cash equivalents ................... 1 309 50,388 50,698
Cash and cash equivalents at beginning of period ........ — 1 310 —
Cash and cash equivalents at end of period ................. $ 1 $ 310 $ 50,698 $ 50,698