Westjet 2008 Annual Report Download - page 88
Download and view the complete annual report
Please find page 88 of the 2008 Westjet annual report below. You can navigate through the pages in the report by either clicking on the pages listed below, or by using the keyword search tool below to find specific information within the annual report.-
 1
1 -
2
-
3
-
4
-
5
-
6
-
7
-
8
-
9
-
10
-
11
-
12
-
13
-
14
-
15
-
16
-
17
-
18
-
19
-
20
-
21
-
22
-
23
-
24
-
25
-
26
-
27
-
28
-
29
-
30
-
31
-
32
-
33
-
34
-
35
-
36
-
37
-
38
-
39
-
40
-
41
-
42
-
43
-
44
-
45
-
46
-
47
-
48
-
49
-
50
-
51
-
52
-
53
-
54
-
55
-
56
-
57
-
58
-
59
-
60
-
61
-
62
-
63
-
64
-
65
-
66
-
67
-
68
-
69
-
70
-
71
-
72
-
73
-
74
-
75
-
76
-
77
-
 78
78 -
 79
79 -
 80
80 -
 81
81 -
 82
82 -
 83
83 -
 84
84 -
 85
85 -
 86
86 -
 87
87 -
 88
88 -
 89
89 -
 90
90 -
 91
91 -
 92
92 -
 93
93 -
 94
94 -
 95
95 -
 96
96 -
 97
97 -
 98
98 -
99
-
100
-
101
-
102
 |
 |

84 WestJet 2008 Annual Report
notes to consolidated
fi nancial statements
For the years ended December 31, 2008 and 2007
(Stated in thousands of Canadian dollars, except share and per share data)
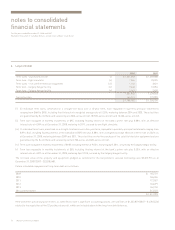
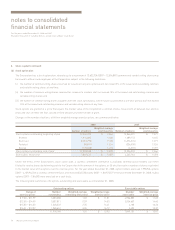
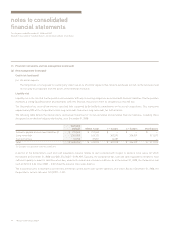
11. Financial instruments and risk management (continued)
(a) Fair value of fi nancial assets and fi nancial liabilities (continued)
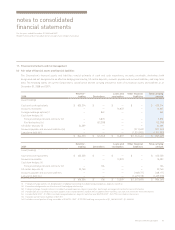
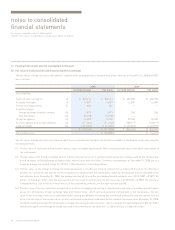
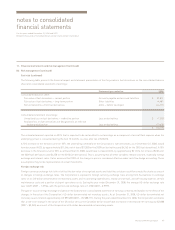
The fair values of fi nancial assets and liabilities, together with carrying amounts, shown in the balance sheet as at December 31, 2008 and 2007,
are as follows:
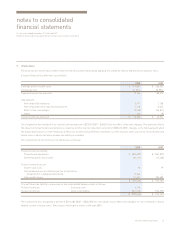
The fair values of fi nancial assets and fi nancial liabilities are calculated on the basis of information available at the balance sheet date using the
following methods:
(i) The fair value of cash and cash equivalents and accounts receivable approximates their carrying amounts due to the short-term nature of
the instruments.
(ii) The fair value of the foreign exchange options is determined by the use of a standard option valuation technique used by the counterparty
based on inputs, including foreign exchange rates, interest rates and volatilities. Contracts outstanding as at December 31, 2008 are at a
weighted average contracted range of 1.1333 to 1.2254 US dollars to Canadian dollars.
(iii) The fair value of the foreign exchange forwards designated in an effective hedging relationship is measured based on the difference
between the contracted rate and the current forward price obtained from the counterparty, which can be observed and corroborated in the
marketplace. As at December 31, 2008, the average contracted rate on the outstanding forward contracts was 1.0519 (2007 – 0.9871) US
dollars to Canadian dollars and the average forward rate used in determining the fair value was 1.2178 (2007 – 0.9907) US dollars to
Canadian dollars. Due to the short-term nature of the outstanding contracts, no discount rate was applied.
(iv) The fair value of the fuel derivatives designated in an effective hedging relationship is determined using inputs, including quoted forward
prices for commodities, foreign exchange rates and interest rates, which can be observed or corroborated in the marketplace. The fair
value of the fuel swap contracts is estimated by discounting the difference between the contractual strike price and the current forward
price. The fair value of the fuel derivative collars is estimated by the use of a standard option valuation technique. As at December 31, 2008,
for the 24 month period that the Corporation is hedged, the closing forward curve for crude oil ranged from approximately US $45 to US $67
and the average forward foreign exchange rate used in determining the fair value was 1.2136 US dollars to Canadian dollars.
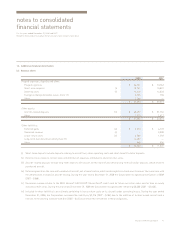
2008 2007
Carrying amount Fair value Carrying amount Fair value
Asset (liability)
Cash and cash equivalents (i) $ 820,214 $ 820,214 $ 653,558 $ 653,558
Accounts receivable (i) 16,837 16,837 15,009 15,009
Foreign exchange options (ii) 862 862 — —
Cash fl ow hedges:
Foreign exchange forward contracts (iii) 5,873 5,873 106 106
Fuel derivatives (iv) (52,298) (52,298) — —
US-dollar deposits (v) 24,309 24,309 22,748 22,748
Accounts payable and accrued liabilities (vi) (211,543) (211,543) (168,171) (168,171)
Long-term debt (vii) (1,351,903) (1,515,487) (1,429,518) (1,473,997)
$ (747,649) $ (911,233) $ (906,268) $ (950,747)
Unrecognized loss $ (163,584) $ (44,479)