Westjet 2008 Annual Report Download - page 38
Download and view the complete annual report
Please find page 38 of the 2008 Westjet annual report below. You can navigate through the pages in the report by either clicking on the pages listed below, or by using the keyword search tool below to find specific information within the annual report.-
 1
1 -
2
-
3
-
4
-
5
-
6
-
7
-
8
-
9
-
10
-
11
-
12
-
13
-
14
-
15
-
16
-
17
-
18
-
19
-
20
-
21
-
22
-
23
-
24
-
25
-
26
-
27
-
 28
28 -
 29
29 -
 30
30 -
 31
31 -
 32
32 -
 33
33 -
 34
34 -
 35
35 -
 36
36 -
 37
37 -
 38
38 -
 39
39 -
 40
40 -
 41
41 -
 42
42 -
 43
43 -
 44
44 -
 45
45 -
 46
46 -
 47
47 -
 48
48 -
49
-
50
-
51
-
52
-
53
-
54
-
55
-
56
-
57
-
58
-
59
-
60
-
61
-
62
-
63
-
64
-
65
-
66
-
67
-
68
-
69
-
70
-
71
-
72
-
73
-
74
-
75
-
76
-
77
-
78
-
79
-
80
-
81
-
82
-
83
-
84
-
85
-
86
-
87
-
88
-
89
-
90
-
91
-
92
-
93
-
94
-
95
-
96
-
97
-
98
-
99
-
100
-
101
-
102
 |
 |

34 WestJet 2008 Annual Report
is booked to completion of the fl ight.
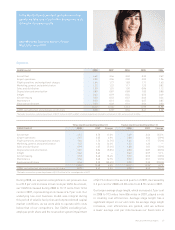
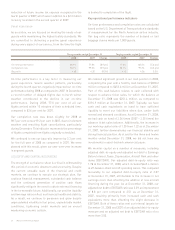
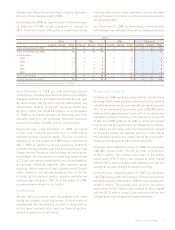
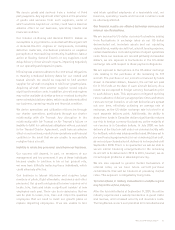
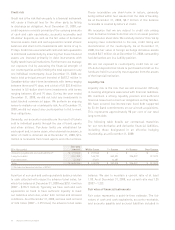
Key operational performance indicators
On-time performance and completion rates are calculated
based on the U.S. Department of Transportation’s standards
of measurement for the North American airline industry.
Our bag ratio represents the number of delayed or lost
baggage claims made per 1,000 guests.
reduction of future income tax expense recognized in the
fourth quarter of 2007, which was in addition to a $2.3 million
recovery recorded in the second quarter of 2007.
Guest experience
As an airline, we are focused on meeting the needs of our
guests while maintaining the highest safety standards. We
are committed to delivering a positive guest experience
during every aspect of our service, from the time the fl ight
Three months ended December 31 Twelve months ended December 31
2008 2007 Change 2008 2007 Change
On-time performance 68.9% 77.8% (8.9 pts) 77.0% 82.6% (5.6 pts)
Completion rate 98.1% 99.0% (0.9 pts) 98.7% 99.2% (0.5 pts)
Bag ratio 4.68 4.32 (8.3%) 4.12 4.26 3.3%
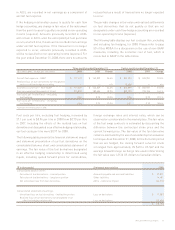
On-time performance is a key factor in measuring our
guest experience. Severe weather patterns, particularly
during the fourth quarter, negatively impacted our on-time
performance during 2008 as compared to 2007. In December,
a record number of delayed fl ights due to harsh winter
weather contributed to the decline in our on-time
performance. During 2008, 77.0 per cent of all our
fl ights arrived within 15 minutes of their scheduled time,
compared to 82.6 per cent for 2007.
Our completion rate was down slightly for 2008 at
98.7 per cent versus 99.2 per cent in 2007, due to inclement
weather and resulting fl ight cancellations, particularly
during December. This indicator represents the percentage
of fl ights completed from fl ights originally scheduled.
We continued to see our bag ratio improve by 3.3 per cent
for the full year of 2008 as compared to 2007. We were
pleased with this result, given our year-over-year increase
in segment guests.
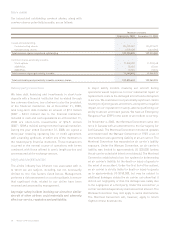
LIQUIDITY AND CAPITAL RESOURCES
The strength of our balance sheet is critical in withstanding
this period of economic downturn and uncertainty. Despite
the current unstable state of the fi nancial and credit
markets, we continue to execute our strategic plan. Our
cautious fi nancial management, substantial cash balance
and the continued generation of positive cash fl ows
signifi cantly mitigate the need to obtain external fi nancing
in the foreseeable future. Additionally, our positive liquidity
and leverage ratios refl ect our fi nancial health and stability.
As a result, we continue to persevere and grow despite
unprecedented volatility in fuel prices, unpredictable market
conditions, tightening credit markets and an overall
weakening economic outlook.
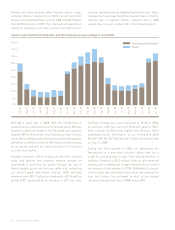
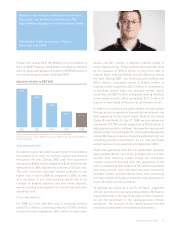
We realized signifi cant growth in our cash position in 2008,
completing the year with a healthy cash balance of $820.2
million compared to $653.6 million at December 31, 2007.
Part of this cash balance relates to cash collected with
respect to advance ticket sales, for which the balance at
December 31, 2008 was $251.4 million, as compared to
$194.9 million at December 31, 2007. Typically, we have
cash and cash equivalents on hand to have suffi cient
liquidity to meet our liabilities when due, under both
normal and stressed conditions. As at December 31, 2008,
we had cash on hand of 3.26 times (2007 – 3.35 times) the
advance ticket sales balance. Additionally, the increase in
our working capital ratio of 1.25 from 1.22 as at December
31, 2007, further demonstrates our fi nancial stability and
strong fi nancial position. As at and for the three and twelve
months ended December 31, 2008, we did not have any
investments in asset-backed commercial paper.
We monitor capital on a number of measures, including
adjusted debt-to-equity and adjusted net debt to Earnings
Before Interest, Taxes, Depreciation, Aircraft Rent and other
items (EBITDAR). Our adjusted debt-to-equity ratio was
1.78 at December 31, 2008, which included $645.4 million
in off-balance-sheet aircraft operating leases. This compared
favourably to our adjusted debt-to-equity ratio of 2.07
at December 31, 2007, attributable to the increase in net
earnings more than offsetting the addition of new aircraft
fi nancing during the year. As at December 31, 2008, our
adjusted net debt to EBITDAR ratio was 2.29, an improvement
of 8.8 per cent compared to 2.51 as at December 31,
2007, resulting primarily from increased cash and cash
equivalents more than offsetting the slight decrease in
EBITDAR. Both of these ratios met our internal targets for
December 31, 2008 and 2007 of an adjusted debt-to-equity
measure and an adjusted net debt to EBITDAR ratio of no
more than 3.00.