Westjet 2008 Annual Report Download - page 3
Download and view the complete annual report
Please find page 3 of the 2008 Westjet annual report below. You can navigate through the pages in the report by either clicking on the pages listed below, or by using the keyword search tool below to find specific information within the annual report.-
 1
1 -
 2
2 -
 3
3 -
 4
4 -
 5
5 -
 6
6 -
 7
7 -
 8
8 -
 9
9 -
 10
10 -
 11
11 -
 12
12 -
 13
13 -
 14
14 -
15
-
16
-
17
-
18
-
19
-
20
-
21
-
22
-
23
-
24
-
25
-
26
-
27
-
28
-
29
-
30
-
31
-
32
-
33
-
34
-
35
-
36
-
37
-
38
-
39
-
40
-
41
-
42
-
43
-
44
-
45
-
46
-
47
-
48
-
49
-
50
-
51
-
52
-
53
-
54
-
55
-
56
-
57
-
58
-
59
-
60
-
61
-
62
-
63
-
64
-
65
-
66
-
67
-
68
-
69
-
70
-
71
-
72
-
73
-
74
-
75
-
76
-
77
-
78
-
79
-
80
-
81
-
82
-
83
-
84
-
85
-
86
-
87
-
88
-
89
-
90
-
91
-
92
-
93
-
94
-
95
-
96
-
97
-
98
-
99
-
100
-
101
-
102
 |
 |
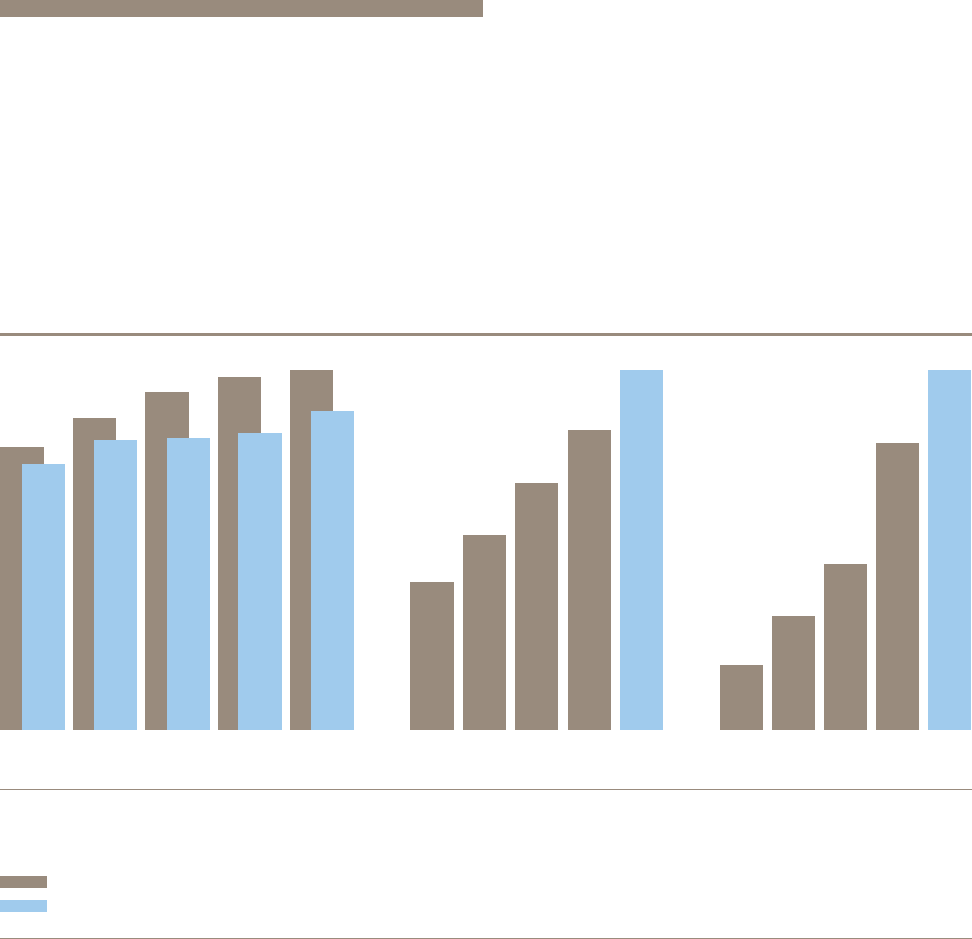
financial
overview
RASM vs. CASM
(cents)
RASM (revenue per available seat mile)
CASM (cost per available seat mile)
Revenue
(millions of dollars)
Cash and
cash equivalents
(millions of dollars)
2004 2005 2006 2007 2008
11.0
12.0 12.1 12.3
13.2
12.9
14.0 14.6 14.9
11.7
2004 2005 2006 2007 2008
149
260
378
654
820
2004 2005 2006 2007 2008
1,050
1,379
1,751
2,127
2,550