Westjet 2008 Annual Report Download - page 31
Download and view the complete annual report
Please find page 31 of the 2008 Westjet annual report below. You can navigate through the pages in the report by either clicking on the pages listed below, or by using the keyword search tool below to find specific information within the annual report.-
 1
1 -
2
-
3
-
4
-
5
-
6
-
7
-
8
-
9
-
10
-
11
-
12
-
13
-
14
-
15
-
16
-
17
-
18
-
19
-
20
-
 21
21 -
 22
22 -
 23
23 -
 24
24 -
 25
25 -
 26
26 -
 27
27 -
 28
28 -
 29
29 -
 30
30 -
 31
31 -
 32
32 -
 33
33 -
 34
34 -
 35
35 -
 36
36 -
 37
37 -
 38
38 -
 39
39 -
 40
40 -
 41
41 -
42
-
43
-
44
-
45
-
46
-
47
-
48
-
49
-
50
-
51
-
52
-
53
-
54
-
55
-
56
-
57
-
58
-
59
-
60
-
61
-
62
-
63
-
64
-
65
-
66
-
67
-
68
-
69
-
70
-
71
-
72
-
73
-
74
-
75
-
76
-
77
-
78
-
79
-
80
-
81
-
82
-
83
-
84
-
85
-
86
-
87
-
88
-
89
-
90
-
91
-
92
-
93
-
94
-
95
-
96
-
97
-
98
-
99
-
100
-
101
-
102
 |
 |

WestJet 2008 Annual Report 27
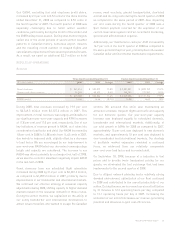
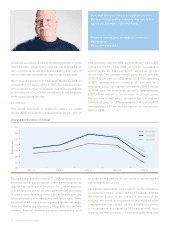
of $31.9 million in the second quarter of 2007, decreased by
3.2 per cent for 2008 to 8.28 cents from 8.55 cents in 2007.
Our longer average stage length, which increased 6.7 per cent
in 2008 to 913 miles from 856 miles in 2007, played a role
in creating cost effi ciencies. Average stage length has a
signifi cant impact on our unit costs. As average stage length
increases, cost effi ciencies are gained, and we achieve
a lower average cost per mile because our fi xed costs of
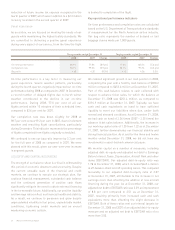
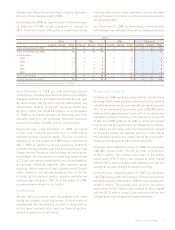
Expenses
During 2008, we experienced signifi cant cost pressure due
to a 35.5 per cent increase in fuel costs per ASM. As a result,
our CASM increased during 2008 to 13.17 cents from 12.34
cents in 2007, representing an increase of 6.7 per cent. Our
underlying low-cost business model was integral during
this period of volatile fuel prices and unprecedented capital
market conditions, as we were able to operate with costs
below that of our competitors. Our CASM, excluding fuel,
employee profi t share and the reservation system impairment
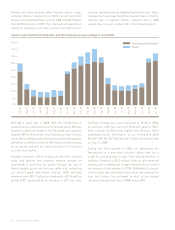
CASM (cents) 2008 2007 2006 2005 2004
Aircraft fuel 4.69 3.46 3.40 3.32 2.69
Airport operations 2.00 2.06 2.02 2.02 1.96
Flight operations and navigational charges 1.64 1.77 1.83 1.71 1.65
Marketing, general and administration 1.22 1.22 1.17 1.23 0.82
Sales and distribution 1.00 1.01 1.00 0.86 1.12
Depreciation and amortization 0.80 0.87 0.89 1.00 0.88
Infl ight 0.62 0.59 0.54 0.50 0.49
Aircraft leasing 0.50 0.52 0.57 0.62 0.46
Maintenance 0.50 0.51 0.54 0.67 0.85
Employee profi t share 0.20 0.33 0.16 0.06 0.03
13.17 12.34* 12.12 11.99 10.95*
CASM, excluding fuel and employee profi t share 8.28 8.55* 8.56 8.61 8.23*
*Excludes reservation system impairment of $31.9 million in 2007 and $47.6 million impairment related to retirement of 200-series aircraft in 2004.
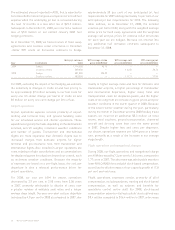
Three months ended December 31 Twelve months ended December 31
CASM (cents) 2008 2007 Change 2008 2007 Change
Aircraft fuel 4.14 3.73 11.0% 4.69 3.46 35.5%
Airport operations 2.15 2.05 4.9% 2.00 2.06 (2.9%)
Flight operations and navigational charges 1.64 1.72 (4.7%) 1.64 1.77 (7.3%)
Marketing, general and administration 1.42 1.24 14.5% 1.22 1.22 —
Sales and distribution 0.99 1.07 (7.5%) 1.00 1.01 (1.0%)
Depreciation and amortization 0.81 0.86 (5.8%) 0.80 0.87 (8.0%)
Infl ight 0.62 0.62 — 0.62 0.59 5.1%
Aircraft leasing 0.53 0.48 10.4% 0.50 0.52 (3.8%)
Maintenance 0.56 0.48 16.7% 0.50 0.51 (2.0%)
Employee profi t share 0.16 0.23 (30.4%) 0.20 0.33 (39.4%)
13.02 12.48 4.3% 13.17 12.34* 6.7%
CASM, excluding fuel and employee profi t share 8.72 8.52 2.3% 8.28 8.55* (3.2%)
*Excludes reservation system impairment of $31.9 million in the second quarter of 2007.
In the WestJet family, we don’t just take care of our
guests; we take care of each other because we’re all
driving for the same results.
Amy Wheatley, Business Advisor, People
WestJetter since 1999