Westjet 2008 Annual Report Download - page 83
Download and view the complete annual report
Please find page 83 of the 2008 Westjet annual report below. You can navigate through the pages in the report by either clicking on the pages listed below, or by using the keyword search tool below to find specific information within the annual report.-
 1
1 -
2
-
3
-
4
-
5
-
6
-
7
-
8
-
9
-
10
-
11
-
12
-
13
-
14
-
15
-
16
-
17
-
18
-
19
-
20
-
21
-
22
-
23
-
24
-
25
-
26
-
27
-
28
-
29
-
30
-
31
-
32
-
33
-
34
-
35
-
36
-
37
-
38
-
39
-
40
-
41
-
42
-
43
-
44
-
45
-
46
-
47
-
48
-
49
-
50
-
51
-
52
-
53
-
54
-
55
-
56
-
57
-
58
-
59
-
60
-
61
-
62
-
63
-
64
-
65
-
66
-
67
-
68
-
69
-
70
-
71
-
72
-
 73
73 -
 74
74 -
 75
75 -
 76
76 -
 77
77 -
 78
78 -
 79
79 -
 80
80 -
 81
81 -
 82
82 -
 83
83 -
 84
84 -
 85
85 -
 86
86 -
 87
87 -
 88
88 -
 89
89 -
 90
90 -
 91
91 -
 92
92 -
 93
93 -
94
-
95
-
96
-
97
-
98
-
99
-
100
-
101
-
102
 |
 |

WestJet 2008 Annual Report 79
notes to consolidated
fi nancial statements
For the years ended December 31, 2008 and 2007
(Stated in thousands of Canadian dollars, except share and per share data)
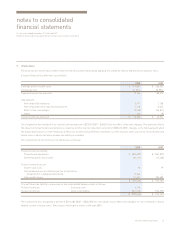
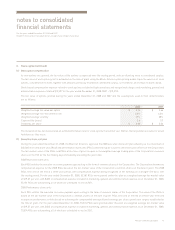
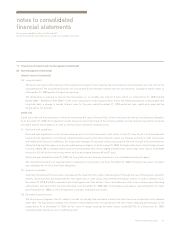
8. Share capital (continued)
(e) Stock option compensation
As new options are granted, the fair value of the options is expensed over the vesting period, with an offsetting entry to contributed surplus.
The fair value of each option grant is estimated on the date of grant using the Black-Scholes option pricing model. Upon the exercise of stock
options, consideration received, together with amounts previously recorded in contributed surplus, is recorded as an increase to share capital.
Stock-based compensation expense related to stock options included in fl ight operations and navigational charges and marketing, general and
administration expenses totalled $12,597 for the year ended December 31, 2008 (2007 – $19,273).
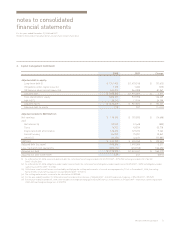
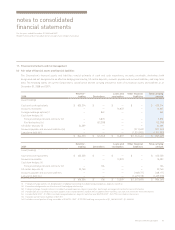
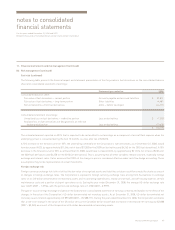
The fair value of options granted during the years ended December 31, 2008 and 2007 and the assumptions used in their determination,
are as follows:
The Corporation has not incorporated an estimated forfeiture rate for stock options that will not vest. Rather, the Corporation accounts for actual
forfeitures as they occur.
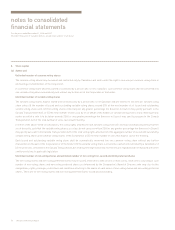
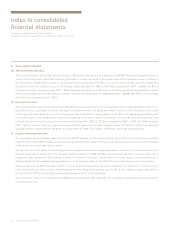
(f) Executive share unit plan
During the year ended December 31, 2008, the Board of Directors approved the 2008 executive share unit plan whereby up to a maximum of
200,000 restricted share units (RSU) and performance share units (PSU) combined may be issued to senior executive offi cers of the Corporation.
The fair market value of the RSUs and PSUs at the time of grant is equal to the weighted average trading price of the Corporation’s common
shares on the TSX for the fi ve trading days immediately preceding the grant date.
2008 Restricted share units
Each RSU entitles the executive to receive payment upon vesting in the form of common shares of the Corporation. The Corporation determines
compensation expense for the 2008 RSUs based on the fair market value of the Corporation’s common shares on the date of grant. The 2008
RSUs time vest at the end of a three-year period, with compensation expense being recognized in net earnings on a straight-line basis over
the vesting period. For the year ended December 31, 2008, 55,181 RSUs were granted under this plan at a weighted average fair market value
of $19.37 per unit, with $385 of compensation expense included in marketing, general and administration expense. As at December 31, 2008,
55,181 RSUs are outstanding, all of which are scheduled to vest in 2011.
2008 Performance share units
Each PSU entitles the executive to receive payment upon vesting in the form of common shares of the Corporation. The value of the PSUs is
based on the fair market value of the Corporation’s common shares on the date of grant. PSUs time vest at the end of a three-year term and
incorporate performance criteria based on achieving the compounded average diluted earnings per share growth rate targets established at
the time of grant. For the year ended December 31, 2008, 73,574 PSUs were granted under this plan at a weighted average fair market value
of $19.37 per unit, with $503 of compensation expense included in marketing, general and administration expense. As at December 31, 2008,
73,574 PSUs are outstanding, all of which are scheduled to vest in 2011.
2008 2007
Weighted average fair value per option $ 5.24 $ 5.66
Weighted average risk-free interest rate 3.0% 4.2%
Weighted average volatility 37% 38%
Expected life (years) 3.6 3.7
Dividends per share $ 0.00 $ 0.00