U-Haul 2009 Annual Report Download - page 88
Download and view the complete annual report
Please find page 88 of the 2009 U-Haul annual report below. You can navigate through the pages in the report by either clicking on the pages listed below, or by using the keyword search tool below to find specific information within the annual report.-
 1
1 -
2
-
3
-
4
-
5
-
6
-
7
-
8
-
9
-
10
-
11
-
12
-
13
-
14
-
15
-
16
-
17
-
18
-
19
-
20
-
21
-
22
-
23
-
24
-
25
-
26
-
27
-
28
-
29
-
30
-
31
-
32
-
33
-
34
-
35
-
36
-
37
-
38
-
39
-
40
-
41
-
42
-
43
-
44
-
45
-
46
-
47
-
48
-
49
-
50
-
51
-
52
-
53
-
54
-
55
-
56
-
57
-
58
-
59
-
60
-
61
-
62
-
63
-
64
-
65
-
66
-
67
-
68
-
69
-
70
-
71
-
72
-
73
-
74
-
75
-
76
-
77
-
 78
78 -
 79
79 -
 80
80 -
 81
81 -
 82
82 -
 83
83 -
 84
84 -
 85
85 -
 86
86 -
 87
87 -
 88
88 -
 89
89 -
 90
90 -
 91
91 -
 92
92 -
 93
93 -
 94
94 -
 95
95 -
 96
96 -
 97
97 -
 98
98 -
99
-
100
-
101
-
102
-
103
-
104
-
105
-
106
-
107
-
108
-
109
-
110
-
111
-
112
-
113
-
114
-
115
-
116
-
117
-
118
-
119
-
120
-
121
-
122
-
123
-
124
-
125
-
126
-
127
-
128
 |
 |

AMERCO AND CONSOLIDATED ENTITIES
NOTES TO CONSOLIDATED FINANCIAL STATEMENTS -- (CONTINUED)
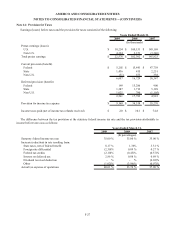
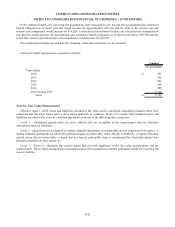
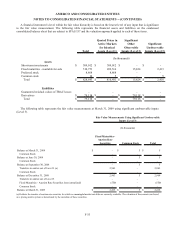
A financial instrument’s level within the fair value hierarchy is based on the lowest level of any input that is significant
to the fair value measurement. The following table represents the financial assets and liabilities on the condensed
consolidated balance sheet that are subject to SFAS 157 and the valuation approach applied to each of these items.
Total
Quoted Prices in
Active Markets
for Identical
Assets (Level 1)
Significant
Other
Observable
Inputs (Level 2)
Significant
Unobservable
Inputs (Level 3)
Assets
Short-term investments $ 309,012 $ 309,012 $ - $ -
Fixed maturities - available for sale 510,753 492,516 15,824 2,413
Preferred stock 8,868 8,868 - -
Common stock 10 5 - 5
Total $ 828,643 $ 810,401 $ 15,824 $ 2,418
Liabilities
Guaranteed residual values of TRAC leases - - - -
Derivatives $ 79,118 $ - $ 79,118 $ -
Total $ 79,118 $ - $ 79,118 $ -
(In thousands)
The following table represents the fair value measurements at March 31, 2009 using significant unobservable inputs
(Level 3).
Fixed Maturities -
Auction Rate
Securities Common Stock Total
Balance at March 31, 2008 $ - $ 5 $ 5
Common Stock - - -
Balance at June 30, 2008 - 5 5
Common Stock - - -
Balance at September 30, 2008 - 5 5
Transfers in and/or out of Level 3 (a) 2,963 - 2,963
Common Stock - - -
Balance at December 31, 2008 2,963 5 2,968
Transfers in and/or out of Level 3 - - -
Fixed Maturities - Auction Rate Securities loss (unrealized) (550) - (550)
Common Stock - - -
Balance at March 31, 2009 $ 2,413 $ 5 $ 2,418
Fair Value Measurements Using Significant Unobservable
Inputs (Level 3)
(In thousands)
(a) Reflects the transfer of auction rate securities for which no meaningful market rate bids are currently available. The valuation of these assets was based
on a pricing matrix system as determined by the custodian of these securities.
F-33