U-Haul 2009 Annual Report Download - page 114
Download and view the complete annual report
Please find page 114 of the 2009 U-Haul annual report below. You can navigate through the pages in the report by either clicking on the pages listed below, or by using the keyword search tool below to find specific information within the annual report.-
 1
1 -
2
-
3
-
4
-
5
-
6
-
7
-
8
-
9
-
10
-
11
-
12
-
13
-
14
-
15
-
16
-
17
-
18
-
19
-
20
-
21
-
22
-
23
-
24
-
25
-
26
-
27
-
28
-
29
-
30
-
31
-
32
-
33
-
34
-
35
-
36
-
37
-
38
-
39
-
40
-
41
-
42
-
43
-
44
-
45
-
46
-
47
-
48
-
49
-
50
-
51
-
52
-
53
-
54
-
55
-
56
-
57
-
58
-
59
-
60
-
61
-
62
-
63
-
64
-
65
-
66
-
67
-
68
-
69
-
70
-
71
-
72
-
73
-
74
-
75
-
76
-
77
-
78
-
79
-
80
-
81
-
82
-
83
-
84
-
85
-
86
-
87
-
88
-
89
-
90
-
91
-
92
-
93
-
94
-
95
-
96
-
97
-
98
-
99
-
100
-
101
-
102
-
103
-
 104
104 -
 105
105 -
 106
106 -
 107
107 -
 108
108 -
 109
109 -
 110
110 -
 111
111 -
 112
112 -
 113
113 -
 114
114 -
 115
115 -
 116
116 -
 117
117 -
 118
118 -
 119
119 -
 120
120 -
 121
121 -
 122
122 -
 123
123 -
 124
124 -
125
-
126
-
127
-
128
 |
 |

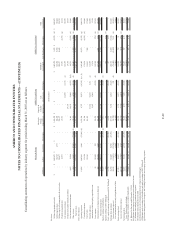
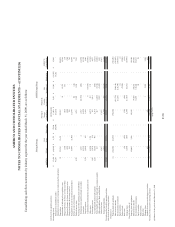
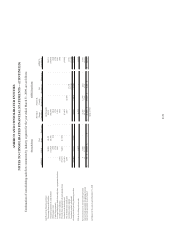
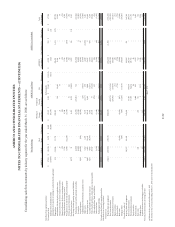
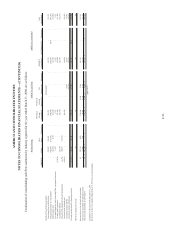
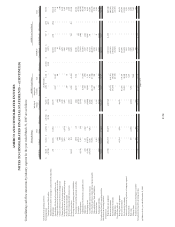
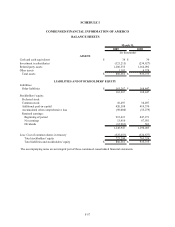
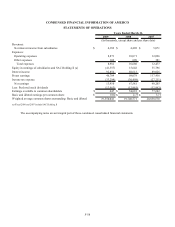
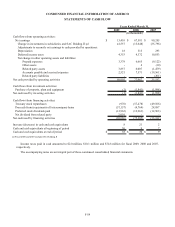
CONDENSED FINANCIAL INFORMATION OF AMERCO
STATEMENTS OF CASH FLOW
2009 2008 2007
Cash flows from operating activities:
Net earnings $ 13,410 $ 67,581 $ 90,205
Change in investments in subsidiaries and SAC Holding II (a) 41,557 (15,648) (35,796)
Adjustments to reconcile net earnings to cash provided by operations:
Depreciation 18 515 293
Deferred income taxes 4,353 4,372 10,853
Net change in other operating assets and liabilities:
Prepaid expenses 3,379 6,665 (9,122)
Other assets - 4 (10)
Related party assets 3,857 6,007 (1,479)
Accounts payable and accrued expenses 2,521 7,571 (19,561)
Related party liabilities - - (201)
Net cash provided by operating activities 69,095 77,067 35,182
Cash flows from investment activities:
Purchase of property, plant and equipment (1) (1,841) (1,998)
Net cash used by investing activities (1) (1,841) (1,998)
Cash flows from financing activities:
Treasury stock repurchases (976) (57,478) (49,106)
Proceeds from (repayments of) intercompany loans (57,157) (4,764) 28,887
Preferred stock dividends paid (12,963) (12,963) (12,963)
Net dividend from related party 2,010 - -
Net cash used by financing activities (69,086) (75,205) (33,182)
Increase (decrease) in cash and cash equivalents 8 21 2
Cash and cash equivalents at beginning of period 30 9 7
Cash and cash equivalents at end of period $ 38 $ 30 $ 9
(a) Fiscal 2008 and 2007 include SAC Holding II
Years Ended March 31,
(In thousands)
Income taxes paid in cash amounted to $2.0 million, $10.1 million and $74.8 million for fiscal 2009, 2008 and 2007,
respectively.
The accompanying notes are an integral part of these condensed consolidated financial statements.
F-59