U-Haul 2009 Annual Report Download - page 3
Download and view the complete annual report
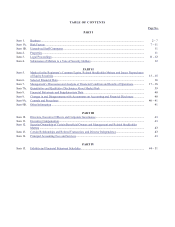
Please find page 3 of the 2009 U-Haul annual report below. You can navigate through the pages in the report by either clicking on the pages listed below, or by using the keyword search tool below to find specific information within the annual report.-
 1
1 -
 2
2 -
 3
3 -
 4
4 -
 5
5 -
 6
6 -
 7
7 -
 8
8 -
 9
9 -
 10
10 -
 11
11 -
 12
12 -
 13
13 -
 14
14 -
15
-
16
-
17
-
18
-
19
-
20
-
21
-
22
-
23
-
24
-
25
-
26
-
27
-
28
-
29
-
30
-
31
-
32
-
33
-
34
-
35
-
36
-
37
-
38
-
39
-
40
-
41
-
42
-
43
-
44
-
45
-
46
-
47
-
48
-
49
-
50
-
51
-
52
-
53
-
54
-
55
-
56
-
57
-
58
-
59
-
60
-
61
-
62
-
63
-
64
-
65
-
66
-
67
-
68
-
69
-
70
-
71
-
72
-
73
-
74
-
75
-
76
-
77
-
78
-
79
-
80
-
81
-
82
-
83
-
84
-
85
-
86
-
87
-
88
-
89
-
90
-
91
-
92
-
93
-
94
-
95
-
96
-
97
-
98
-
99
-
100
-
101
-
102
-
103
-
104
-
105
-
106
-
107
-
108
-
109
-
110
-
111
-
112
-
113
-
114
-
115
-
116
-
117
-
118
-
119
-
120
-
121
-
122
-
123
-
124
-
125
-
126
-
127
-
128
 |
 |

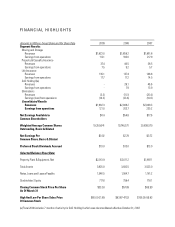
Amounts in Millions, Except Share and Per Share Data 2009 2008 2007
Segment Results:
Moving and Storage
Revenues $1,823.0 $1,858.2 $1,861.8
Earnings from operations 112.1 193.0 217.9
Property & Casualty Insurance
Revenues 37.4 40.5 38.5
Earnings from operations 7.5 9.2 5.7
Life Insurance
Revenues 135.1 137.4 148.8
Earnings from operations 17.7 17.2 14.5
SAC Holding II(a)
Revenues - 28.1 46.6
Earnings from operations - 7.9 13.9
Eliminations
Revenues (3.3) (15.1) (26.4)
Earnings (loss) from operations (16.3) (23.6) (16.8)
Consolidated Results
Revenues $1,992.3 $2,049.2 $2,069.3
Earnings from operations 121.0 203.7 235.2
Net Earnings Available to $0.4 $54.8 $77.6
Common Shareholders
Weighted Average Common Shares 19,350,041 19,740,571 20,838,570
Outstanding, Basic & Diluted
Net Earnings Per $0.02 $2.78 $3.72
Common Share, Basic & Diluted
Preferred Stock Dividends Accrued $13.0 $13.0 $13.0
Selected Balance Sheet Data:
Property, Plant & Equipment, Net $2,013.9 $2,011.2 $1,897.1
Total Assets 3,825.0 3,832.5 3,523.0
Notes, Loans and Leases Payable 1,546.5 1,504.7 1,181.2
Stockholders’ Equity 717.6 758.4 718.1
Closing Common Stock Price Per Share $33.53 $57.09 $69.99
As Of March 31
High And Low Per Share Sales Price $60.00-21.89 $83.87-47.53 $106.95-59.83
Of Common Stock
(a) Fiscal 2008 includes 7 months of activity for SAC Holding II which was deconsolidated effective October 31, 2007.
FINANCIAL HIGHLIGHTS